OPEN
ATTACHMENTS
Ordinary meeting of the
Works and Infrastructure Committee
Thursday
22 October 2015
Commencing
at 9.00am
Wakapuaka
Hall
460
State Highway 6
Main
Road, Wakapuaka
Nelson
ATTACHMENTS UNDER SEPARATE COVER
8 Transportation
Asset Management Plan 2015-2025
2 A1156705 -
Transport Asset Management Plan 2015-2025 2
Asset Management Plan
2015 - 25

Quality Assurance Statement
|
Version No.
|
Date
|
Description
|
Prepared by
|
Reviewed by
|
Approved by
|
|
1
|
24/3/14
|
draft
for
assets review
|
R
Palmer
|
Assets
Team
|
A
Louverdis
|
|
2
|
5/5/14
|
draft
including financial and work programmes
|
R
Palmer
|
Assets
Team
|
A
Louverdis
|
|
3
|
19/5/14
|
draft
for SLT
|
R
Palmer
|
SLT
|
A
Louverdis
|
|
4
|
5/6/14
|
draft
for Council workshop
|
R
Palmer
|
Councillors
|
A
Louverdis
|
|
5
|
18/12/14
|
Approved
by
Council
|
R
Palmer
|
SLT
|
A
Louverdis
|
|
6
|
15/10/15
|
Approved
by Council to match LTP
|
R
Palmer
|
Councillors
|
Council
|
Yellow highlighted text indicates changes to version 5 as a
result of the LTP
Blue highlighted text indicates changes to version 5 as a
result of the other factors
Part 1
Executive Summary. 1
1................ Introduction.. 12
1.1. Purpose. 12
1.2. Plan structure. 12
1.3. The transport activity. 12
1.4. The stakeholders 13
1.5. The end users 14
1.6. The legislative context 15
1.7. Strategic context 15
2................ WHAT ARE THE FUTURE DEMAND
ISSUES TO CONSIDER?. 19
2.1. Arterial Traffic. 21
2.2. Accessibility. 22
2.3. Sustainability. 23
2.4. Environmental risks 24
2.5. Regional considerations 24
2.6. Funding. 25
2.7. Funding Risk. 26
2.8. Transport network resilience. 26
2.9. Consultation. 27
2.10. Procurement strategy. 28
2.11. Prioritisation process for projects 28
3................ What’s the direction?. 29
3.1. Context 29
3.2. What are the impacts of moving people and goods?. 31
3.3. A brief history of street design and improvements
programme. 32
3.4. What are the options?. 33
3.5. A balanced approach. 34
4................ The delivery of a balanced
approach. 35
4.1. Defining the Targets and the Delivery. 35
4.2. Local roads, walking, cycling and schools 35
4.3. Arterial traffic. 48
4.4. Safety. 50
4.5. Public transport 54
4.6. Parking. 55
4.7. Value for Money principles 57
4.8. Systems to Measure, Monitor and Report on Performance
Indicators 59
Part 2
5................ Technical Performance
measures/Asset management Systems/lifecycle. 63
5.1. Asset lifecycle. 63
5.2. Asset failure modes 64
5.3. Roads 64
5.4. Road structures 67
5.5. Pedestrian network. 70
5.6. Cycle network. 74
5.7. Public Transport 77
5.8. Traffic control and equipment, street lighting, signs
and markings 79
5.9. Safety. 81
5.10. Parking. 84
6................ Valuation.. 87
7................ Financial Forecasts and
Development Contributions. 88
8................ Risk management. 90
9................ Performance Monitoring and
Improvement Plan.. 99
List of Appendices
Appendix A Relevant transport legislation. 102
Appendix B Nelson’s Strategies and Policies 103
Appendix C Strategic documents, studies and models providing
demand data. 107
Appendix D Growth indicators 109
Appendix E How the focus areas link with the government’s,
NZ Transport Agency’s and Council’ s strategic documents 142
Appendix F Definition of Levels of Service. 145
APPENDIX G STREETS WITHOUT FOOTPATHS. 148
Appendix H Annual Peak travel time delays on Rocks Road and Waimea
Road. 149
Appendix I Previous LEVEL OF SERVICE and why they have changed. 152
Appendix J SUMMARY activity descriptions 153
Appendix K Regional Land Transport Programme 2015-2021. 161
APPENDIX l 10 YEAR LONG TERM PLAN –
PROGRAMME. 166
Appendix M minor improvement and footpaths Priority List 171
Appendix N Footpath Rehabilitation Sites 175
Table 1.1 Te Tau Ihu Settlement Bill Proposed Redress 14
Table 1.2 Council Community Outcomes 17
Table 2.1 NZ Transport Agency Financial Assistance Rates 25
Table 4.1 Level of Service Relating to Walking and Cycling. 36
Table 4.2 Level of Service Relating to Maintenance of Footpaths 36
Table 4.3 Footpath Rating Descriptions and Summary. 38
Table 4.4 Level of Service Relating to Local Road Maintenance and
Renewals 40
Table 4.5 Practical seal lives in Nelson. 42
Table 4.6 Proportion of Road Surface in Nelson by Type and
Traffic Volume. 43
Table 4.7 Level of Service Relating to Efficient Transport System.. 48
Table 4.8 Level of Service relating to Road Network and Its
Services 49
Table 4.9 Level of Service Relating to Road Safety. 50
Table 4.10 Level of Service Relating to Road Safety at
Intersections 51
Table 4.11 Level of Service Relating to Road Safety and Cyclists 52
Table 4.12 Level of Service Relating to Road Safety and
Pedestrians 52
Table 4.13 Level of Service Relating to Public Transport Services 54
Table 4.14 Level of Service Relating to Short Stay Parking. 56
Table 4.15 Level of Service Relating to Parking. 56
Table 4.16 Level of Service Relating to Long Stay Parking. 56
Table 4.17 Level of Service Relating to Public Satisfaction. 58
Table 5.1 Key Stages in the Asset Lifecycle. 63
Table 5.2 Range of Asset Failure Modes 64
Table 5.3 Road Surface Valuation. 64
Table 5.4 Road Basecourse Valuation. 64
Table 5.5 Road Surface Data Reliability Analysis 66
Table 5.6 Road Base Data Reliability Analysis 66
Table 5.7 Bridges Valuation. 67
Table 5.8 Retaining Wall Valuation. 67
Table 5.9 Road Structure Data Reliability Analysis 69
Table 5.10 Footpaths Valuation. 70
Table 5.11 Walkways Valuation. 70
Table 5.12 Footway Data Reliability Analysis 72
Table 5.13 Cycleways Valuation. 74
Table 5.14 Cycle Infrastructure Data Reliability Analysis 76
Table 5.15 Fares as at July 2014. 78
Table 5.16 Street Signs Valuation. 79
Table 5.17 Line Marking Valuation. 80
Table 5.18 Streetlights Valuation. 80
Table 5.19 Traffic Signals Valuation. 80
Table 5.20 Car Parking Valuation. 84
Table 5.21 Car Parking Spaces in Nelson and Stoke. 84
Table 5.22 Car Parking Data Reliability Analysis 85
Table 7.1 Forecasted Subsidised Annual Expenditure. 88
Table 8.1 Likelihood Ratings (Semi Qualitative Measure) 90
Table 8.2 Semi-Quantitative Measures of Consequence and Areas of
Impact 90
Table 8.3 Risk Priority Rating (Semi Quantitative) 91
Table 8.4 Business Risk Schedule. 92
Table 8.5 Asset Risk Schedule. 96
Table D.1 Peak Hour Volumes 109
Table D.2 Population projections, 2015-2045. 139
Tabel F.1 Definition of Levels of Service. 145
Table F.2 Nelson Arterial Traffic Study Network Performance
Summary Statistics 147
Table F.3 Nelson Arterial Traffic Study Network Performance
Summary Statistics 147
Figure 1.1 Relationship between Statutes and Policy Documents 17
Figure 2.1 Projected Population and Households
Growth. 21
Figure 3.1 2013 Residents Survey. 33
Figure 4.2 Main Means of Travel to Work. 38
Figure 4.3 Average Road Roughness Standards by Road Classification. 41
Figure 4.4 Expected Future Resurfacing Costs/Liability. 44
Figure 4.5 Road Network Surface Condition. 45
Figure 4.6 Number of Fatal and Serious Injuries on Local Roads in
Nelson. 50
Figure 4.8 Number of Cyclist Crashes in Nelson City. 52
Figure 4.9 Number of crashes involving pedestrians in Nelson City. 53
Figure 4.10 Percentage of Public Dissatisfied with the Transport
Activity. 58
Figure 5.1 Remaining Asset Life of Retaining Walls 68
Figure 5.2 Existing and Proposed Cycle Network. 75
Figure 5.3 Zone Structure and Bus Routes 77
Figure D.1 Nelson Arterial Traffic Volumes 110
Figure D.2 Waimea-AM Peak Hour Ending 0900. 111
Figure D.3 Waimea – Peak Hour Ending 1700. 112
Figure D.4 Waimea – Midday Peak Hour Ending 1300. 113
Figure D.5 Waimea – Weekday AM Peak Hour Ending 0900. 114
Figure D.6 Waimea – Weekday PM Peak Hour Ending 1700. 115
Figure D.7 Waimea – Weekday Midday Peak Hour Ending 1300. 116
Figure D.8 Rocks Road -AM Peak Hour Ending 0900. 117
Figure D.9 Rocks Road– PM Peak Hour Ending 1700. 118
Figure D.10 Rocks Road– Midday Peak Hour Ending 1300. 119
Figure D.11 Rocks Road – Weekday AM Peak Hour Ending 0900. 120
Figure D.12 Rocks Road– Weekday PM Peak Hour Ending 1700. 121
Figure D.13 Rocks Road – Weekday Midday Peak Hour Ending 1300. 122
Figure D.14 Main Road Stoke –AM Peak Hour Ending 0900. 123
Figure D.15 Main Road Stoke – PM Peak Hour Ending 1700. 124
Figure D.16 Main Road Stoke – Midday Peak Hour Ending 1300. 125
Figure D.17 Main Road Stoke – Weekday AM Peak Hour Ending
0900. 126
Figure D.18 Main Road Stoke – Weekday PM Peak Hour Ending
1700. 127
Figure D.19 Main Road Stoke– Weekday Midday Peak Hour Ending
1300. 128
Figure D.20 Waimea – Rocks Road - AM Peak Hour Ending 0900 -
Screenline. 129
Figure D.21 Waimea – Rocks Road - PM Peak Hour Ending 1700 -
Screenline. 130
Figure D.22 Waimea – Rocks Road - Midday Peak Hour Ending
1300 - Screenline. 131
Figure D.23 Waimea – Rocks Road – Weekday AM Peak Hour
Ending 0900 - Screenline. 132
Figure D.24 Waimea – Rocks Road – Weekday PM Peak Hour
Ending 1700 - Screenline. 133
Figure D.25 Waimea – Rocks Road – Weekday Midday Peak
Hour Ending 1300 - Screenline. 134
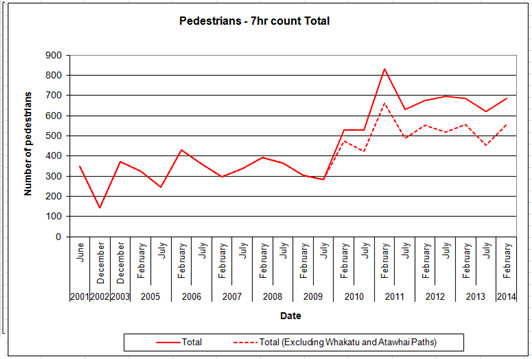
Figure D.26 Pedestrian Counts 135
Figure D.27 Pedestrian – 7 hr Count Total 135
Figure D.28 2010 Comprehensive Cyclist and Pedestrian Count 136
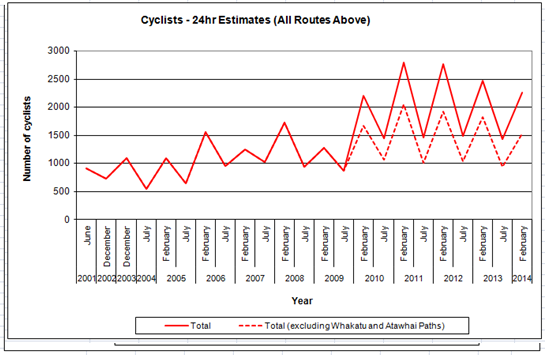
Figure D.29 Cyclists – 24 hrs Estimates 137
Figure D.30 Cyclists – 24 hrs Estimates (All Routes Above) 137
Figure D.31 2010 Comprehensive Cyclist and Pedestrian Count 138
Figure D.33 Nelson - Projected population,
2015-2045. 139
Figure D.34: Population projections by age groups,
Nelson. 140
Figure F.1 Nelson-Tasman Transportation Model Link LoS Criteria. 146
Figure H.1 Annual Average Morning Peak Travel Times – Waimea
Road. 149
Figure H.2 Annual Average Evening Peak Travel Times – Waimea
Road. 149
Figure H.3 Annual Average Morning Peak Travel Times – Rocks
Road. 150
Figure H.4 Annual Average Evening Peak Travel Times – Rocks
Road. 150
The transport activity
The
Transport services and assets associated with this activity are primarily
focussed on the safe, efficient and effective transport of people and goods
around the Nelson region. This includes the provision, operation and
maintenance of physical infrastructure on the road reserve such as for driving,
parking, cycling and walking as well as the provision of safety, traffic
control and public transport services.
The
replacement cost of these assets is approximately $700 million, and the
depreciated value is $570 million. This represents nearly 43% of Council
assets.
This
Asset Management Plan provides evidence based information on how transport
activity in Nelson is performing, based on measurable levels of service and
performance indicators. It is based on a sustainable whole of system approach
that supports the type of City we want Nelson to be; safe, accessible and
affordable to all.
National and local policy on transport
This
Transport Asset Management Plan (TAMP) provides Council with the year to year
financial guidance on the allocation of transport funds. It is a tactical,
locally focussed document; developed around national and regional transport
funding guidelines as indicated by the requirements of the New Zealand
Transport Agency (NZTA) and the Government Policy Statement (GPS) on Land
Transport Funding. It will guide the transport spending for the years
2015-2018, as updated each year by the annual plan. The project programme in
this TAMP will inform the transport spending in the Long Term Plan, both for
the subsidised and unsubsidised sectors.
Previously
this document has been developed within the broad guidelines set by the 2009
Regional Land Transport Strategy (RLTS) which supported a safe, efficient,
integrated, sustainable land transport system. These guidelines have influenced
the management of transport, specifically the subsidised policy, in Nelson over
the last 6 years.
The
Draft Government Policy Statement 2015
(GPS) on Land Transport Funding is issued by the Minister of Transport every
three years. It has set out the below 3 government’s priorities for
expenditure from the National Land Transport Fund over the next 10 years,
broadly continuing the overall direction set by the Government Policy Statement
in 2012 & 2009.
· A strong and continuing focus on
economic growth and productivity – The government’s investment in land transport
should support increased economic growth and productivity in New Zealand.
· Value-for-money – Land transport services
should be delivered better and smarter. Asset management will be improved to
boost performance of roading infrastructure. The Government Policy Statement
2015 makes it clear that getting more out of what is spent is expected.
· Road safety – Road safety is a transport
priority for the government. Safer Journeys, the Government’s road safety
strategy, will be supported through the next National Land Transport Programme.
The
Draft Regional Land Transport Plan
2015 – 2021 (RLTP) (due for public
consultation in November 2014) sets out the subsidised transport
prioritised programme for the six years in accordance with the NZ Transport
Agency’s Investment and Revenue Strategy and in accordance with the GPS
and this TAMP.
This
approach in Nelson will continue to influence the management of private vehicle
use by encouraging transport behavioural change, providing an integrated
transport network that encourages all forms of transport, providing and
improving modal choice and reducing the demand for travel.
The RLTP 2015 – 2021 has been adopted and confirms the
direction detailed above.
The
available means of achieving this are complex and inter-related. It is clear
that no single measure in isolation will be successful in meeting the high
level objectives and an integrated package of measures is required.
Key Issues
SUSTAINABILITY
Council
has taken a “sustainable” approach to its transport network since
the development of the 2009 Regional Land Transport Strategy. That strategy
supported maintaining our existing transport infrastructure, increasing
walking, cycling and passenger transport travel choices, and a targeted focus
on growth areas. The direction started in the Regional Land Transport Strategy
has been extended in this Asset Management Plan by rebalancing spending to
projects of need, that increase mode choice and safety, rather than pursuing
uneconomic low value for money projects. This direction is supported by the draft
2015 GPS objectives ‘providing appropriate transport choices’,
‘appropriately mitigates the effects of land transport on the
environment’ and ‘addresses current and future demand’ by
targeting growth areas. It also recognises the need for economic growth and the
importance of efficient and effective freight transport to the Nelson region.
Arterial Traffic
The
Arterial Traffic Study, in agreement with NZ Transport Agency in 2010
determined that:
· There is not a significant traffic problem in Nelson,
nor is one forecast to develop over the modelled time period of the study
– the next 25 years.
Council’s
resolution differed from the NZ Transport Agency approved study’s
recommendations insofar as:
· Council retain protection of the Southern Arterial
Corridor only.
Ongoing
traffic monitoring of the arterial routes shows that the traffic volumes are
flat to declining in line with national and global observed trends. The decline
is likely to be a result of many influences such as, technology developments
reducing need to travel, an increase in walking, cycling and bus patronage,
increases in car occupancy rates, reduction in teen drivers, ageing population
travelling less and outside of peak times and increased cost of fuel.
Following the National Election in 2014 the Government
announced that they would investigate the Southern Arterial Corridor using
their Future Investment Fund.
Maintenance Operations and Renewals
Maintaining
the transport infrastructure is key to ensuring we provide the desired level of
service in the most cost effective manner. One of the key high cost components
of the transport asset is the seal surface that waterproofs the pavement
structure. Council currently has a backlog of surfaces that are overdue for
resealing and treating this backlog is important to ensure that the life of our
pavement structure is maximised.
Street
lighting also has a backlog of aged fittings. Of greatest priority is the
replacement of the inefficient and polluting mercury vapour lights on the
network with LED fittings.
Condition
assessments of the key transport assets are undertaken to ensure that they are
maintained and renewed at the most cost effective time, however our knowledge
of the remaining life of the assets and thus their depreciation needs improving
in order better manage the maintenance and renewal future liability. This is a
key component of the improvement plan.
PARKING
A
parking study was undertaken in 2014 that informed the development of the draft
‘Parking Strategy 2014-2024’.
Survey
data collected in 2005, 2008 and 2012 shows there is an appropriate supply of
parking. Forecasting indicates there is unlikely to be any significant increase
in demand over the next ten years.
The
engagement undertaken has indicated that the Nelson public consider the key
parking issues to broadly include enforcement, cost and payment options and all
day CBD parking.
Subsequent
to the draft parking strategy being prepared, Council, in response to the
concerns of inner city retailers, resolved to remove the charge for parking for
a winter trial period. As a result, finalisation of the strategy has been
delayed until after this AMP has been completed. This AMP allows for the
implementation of the actions detailed in the draft parking strategy but recognises
that the direction and content of the parking strategy may change and some
actions may not be necessary or other options may be trialled to ascertain
their impact before the future direction is set.
Council resolved during the LTP deliberations to continue
with the first hour of parking being free to users and then costing $1.50 per
hour after that. The actions contained in the AMP appropriately reflect the
intent of the draft strategy and no changes are necessary.
Nelson and Stoke CBD ENHANCEMENT
A
number of projects identified in the Heart of Nelson – Central City
Strategy have been completed to date. As
part of the Long Term Plan 2015-25 (LTP) development Council will
need to prioritise the remaining projects during
2015/16, determining which are still relevant, and considering if there
are any new projects that should be added. To inform this work data is
being collected on the retail, employment and economic dynamics in the city. In
conjunction with reporting back on the free parking trial period this will
provide guidance on future projects within the Central City.
It
is also clear residents feel Stoke CBD has been neglected over recent years and
projects to revitalise the area, continue to provide for growth and facilities
are overdue for funding. This TAMP includes Stoke CBD traffic and parking
projects.
FREIGHT
Port
Nelson as the maritime gateway to the region is extremely important to the
economic development of Nelson and the wider region as it provides the ability
for primary production to be exported. In the year ending June 2013 2.6M
revenue tonnes were exported or imported via Port Nelson over the road network.
With the greatest reliance on the primary industries of any region in the
country it is critically important that the local road network is resilient and
efficient for freight especially the routes to and from the port.
NZTA
are predicting an increasing freight task of approximately 2% per annum with a
key component of that a peak log harvest for the Nelson Marlborough Tasman area
in the 2020 – 2025 period of double the current tonnage.
The
50 MAX vehicles have recently been introduced to allow more freight to be
carried on fewer trucks on the local road network. 50 MAX High Productivity
Motor Vehicles (HPMV) are trucks that are slightly longer than the standard 44
tonne vehicles. The modified design means that these trucks can carry more, but
they perform on the road in the same way as a standard 44 tonne truck. The 50
MAX vehicles have an improved safety record and should not increase wear and
tear on the road network. This TAMP proposes improvements to the bridges in the
Maitai Valley to allow 50Max vehicles to access the adjacent forestry blocks.
FUNDING
The
NZ Transport Agency, like Council, works on a three year funding cycle. The Transport
Agency allocates funding to local authorities through the National Land
Transport Plan which it adopts in July 2015, after considering each Regional
Land Transport Plan (RLTP).
The
Funding Assistance Rate (FAR) is the co-investment rate for transport
activities that Council receives from the NZ Transport Agency In 2013 and 2014
the NZ Transport Agency reviewed the principals and methods used in setting the
FAR. The NZTA have confirmed recently advised
that there will be a single FAR for all activities and that Nelson’s FAR
will increase. Nelson’s 14/15 current
effective FAR for all activities was 46%. For the 2015/16 year the NZ Transport
Agency has confirmed indicated that
the FAR will be 47% and will rise by 1% per annum to 51% over five years.
This
Asset Management Plan proposes a significant increase in expenditure for
renewing the existing network.
There
are several transport activities that Council already funds from rates without
any co-investment. As investment rules tighten, Council always has the option
of continuing with the activity or improving the level of service for an
activity by increasing the activity’s funding from rates over the three
year TAMP time frame.
The
NZ Transport Agency introduced the One Network Road Classification (ONRC) at
the end of 2013. It is proposed that this replaces Councils’ Road
Hierarchy over time. This classification is to be implemented nationwide in
order to provide more consistency in levels of service and the corresponding
funding levels between regions. The effects of the ONRC on NZTA’s
investment levels in Nelson City are uncertain at this stage.
During the development of the National Land Transport
Programme the NZ Transport Agency did not fund the maintenance and operations
budget to the level requested in the RLTP or this AMP.
The LTP retained a total of $325,000 in years two and three
of the Long Term Plan so Council will be in a position to take up any
additional funding should the NZ Transport Agency make it available for
transportation renewals as originally proposed by the Regional Land Transport
Plan and this TAMP.
Public satisfaction with the Transport activity
The
2014 Residents survey also showed that levels of satisfaction with the
transport activity have remained relatively static over the last three years as
can be seen in the figure below.
2014
Public Satisfaction With The Transport Activity
Residents
who were dissatisfied with transport gave this rating because they felt public
transport was limited (35%), or that cycleways need improvement (33%). Twenty
nine per cent identified the roads need improvement.
A Balanced approach to transport strategy
The
2012 Transport Asset Management Plan adopted a “balanced approach”
towards transport in Nelson and that approach has been continued through to
this Plan.
Nationally
and internationally, current transport planning has supported the encouragement
of sustainable and alternative forms of transport for many years now, and
Nelson has been at the forefront of actively supporting these forms of
transport for over 15 years. Nelson has adopted a strategic momentum towards
providing greater quality transport choices through the Asset Management Plans,
the Regional Land Transport Strategy, Plan Changes and Council’s
strategic sustainability policies. This has been effective in improving the
walking and cycling networks in Nelson, and has supported the development of
improved reliable public transport that offer viable options to residents.
Nelson has developed a distinct travel choice culture.
This
approach is fundamental to this TAMP and to the continued integrated delivery
of projects by NCC over coming years. This will result in lower cost local road
upgrades which are fit for purpose, provide opportunities for travel choices
optimised whenever any project permits, and the travel needs of all road users
recognised and catered for as feasible. In doing so Council:
· Recognises the importance of well
located, strong transport corridors that offer the potential for the efficient
and safe flow of people and freight to assist the economic vitality of our
region, and;
· Acknowledges
that more integrated approaches to traffic flow (the importance of slower
speeds and placing a greater emphasis on walking, cycling and a sense of place)
are necessary on our local roads and residential streets to promote social and
community networks, supportive neighbourhoods, urban centres and safe streets.
Level of Service Summary Table
It
must be recognised that Council has varying ability to influence some of these
levels of service.
|
Level of Service
|
Performance Indicator
|
Current Performance
|
AMP Section Reference
|
Performance Target
|
|
MAINTENANCE
|
|
The
Network, and its services in good condition and are “fit for
purpose”
|
Smooth
Travel Exposure*
|
87%
|
4.2.3,
4.2.4, 5.3
|
87%
based on NZ Transport Agency standard roughness limits in ONRC
|
|
The
Network, and its services in good condition and are “fit for
purpose”
|
Average
road roughness standard (National Association of Australian State Roading
Authorities) by road classification.
|
Arterial/Principal,
69/90
Collector/Sub
C, 97/117
|
4.3,
5.3
|
The
following maximum average road roughness are not exceeded:
Arterial/Principal,
100
Collector/Sub
C, 110
|
|
The
Network, and its services in good condition and are “fit for
purpose”
|
Average
road roughness standard (National Association of Australian State Roading
Authorities) by road classification.
|
Local,
106
Rural
Sealed, 97
|
4.2.3,
4.2.4, 5.3
|
The
following maximum average road roughness are not exceeded:
Local,120
Rural
sealed, 120
|
|
The
Network, and its services in good condition and are “fit for
purpose”
|
The
percentage of the local road (non State Highway) that is resurfaced annually*
|
4.8%
|
4.2.3,
4.2.4, 5.3
|
6.4%
- 7.4%
|
|
The
Network, and its services in good condition and are “fit for
purpose”
|
The
percentage of footpaths that meet or exceed the maximum acceptable roughness*
|
95%
|
4.2.1,
5.5
|
95%
of the footpath network by length has a condition rating of ≤ 3
|
|
LOCAL
ROADS, WALKING, CYCLING AND SCHOOLS
|
|
Walking
and cycling are easy and attractive alternative transport choices.
|
Percentage
of the community that travel to work by walking or cycling (based on Nelson
City Council Annual Residents Survey and/or national census).
|
16%
walked or cycled from the 2014 survey of residents. 2013 census data shows
that 18.3% walked or cycled to work.
|
4.2.1,
4.8.1, 5.5, 5.6
|
25%
of all journeys to work trips are by walking or cycling by 2018.
|
|
ARTERIAL
TRAFFIC
|
|
An
efficient transport system that enables people and freight to move
efficiently.
|
Average
AM and PM peak hour travel times on Waimea Road and the State Highway between
Annesbrook and Haven Road roundabout
|
Rocks
Road PM peak delay = 3min
Waimea
Road AM peak delay = 2min
|
4.3,
4.8.2
|
Average
peak hour travel time delays are no greater than 5 minutes above uncongested
travel times.
|
|
ROAD
SAFETY
|
|
Road
Safety
|
Number
of fatalities and serious injury crashes on the local road network*
|
The
target of a maximum of 12 fatalities and serious injuries in 2013 was met
with 12 recorded for that year.
|
4.4,
4.8.3, 5.9
|
The
number of fatalities and serious injuries on local roads reduces by 4% per
year from a base of 2007
|
|
Road
safety
|
Number
of injury crashes per kilometre of road.
|
2012
Calendar year rate is below maximum. Complete data for 2013 not available yet
|
4.4,
4.8.3, 5.9
|
The
collective risk for each year reduces by at least 4% per year from a base of
2007
|
|
Road
safety
|
Annual
social cost of crashes (injury and non-injury) at intersections.
|
Target
not met for 2012 after good performance in 2010 and 2011. The social cost of
crashes was marginally above the target
|
4.4,
4.8.3, 5.9
|
The
social cost for each year reduces by at least 4% per year from a base of 2007
|
|
Road
safety
|
Number
of crashes involving cyclists.
|
Target
met for 2013. The number of cycle crashes (23) was the same as the target
2007 number.
|
4.4,
4.8.3, 5.9
|
Nelson
City cycle crash numbers do not increase from those in the base year of 2007
|
|
Road
safety
|
Number
of crashes involving pedestrians
|
Target
not met for 2013. The number of crashes involving pedestrians was 12, 100%
more than the target number of 6.
|
4.4,
4.8.3, 5.9
|
Number
of crashes involving pedestrians each year reduces by at least 4% per year
from a 2007 base.
|
|
Road
Safety
|
Total
five year average social cost of urban crashes (injury and non-injury) at the
worst 10 intersections
|
The
social cost for 2013/14 worst 10 intersections was $4.2million compared with
an average of $4.6million for the previous five years.
|
4.4,
4.8.3, 5.9
|
The
annual total social cost is below the previous five year average.
|
|
PUBLIC
TRANSPORT
|
|
Public
transport services that meet the transport needs of the community with an
equitable sharing of costs.
|
The
farebox recovery ratio
|
Approximately
60% in 2012/13 and 62% in 2013/14
|
4.5,
4.8.4, 5.7
|
50%
|
|
Level of Service
|
Performance Indicator
|
Current Performance
|
AMP Section Reference
|
Performance Target
|
|
PARKING
|
|
The
supply and pricing of short stay parking is managed to encourage commercial
activity in the Central Business District.
|
Percentage
of short stay parking spaces occupied in midweek peak in December
|
December
2012 - 81%
|
4.6,
4.8.5, 5.10
|
85%
|
|
The
supply and pricing of long stay parking is managed to incentivise greater use
of travel options other than cars.
|
Occupancy
of long-stay parking spaces between peak travel times measured at 5 locations
within the CBD fringe.
|
Not
currently measured but will be in the future.
|
4.6,
4.8.5, 5.10
|
A
reducing trend.
|
|
VALUE
FOR MONEY PRINCIPLES
|
|
Public
satisfaction.
|
Percentage
of public satisfied and dissatisfied with the transport activity (based on
Nelson City Council Annual Residents Survey).
|
Target
not met
55%
of respondents are either very satisfied or satisfied
17%
of respondents are either dissatisfied or very dissatisfied
|
4.7,
4.8.6
|
More
than 50% of respondents are either very satisfied or satisfied, and less than
10% are either dissatisfied or very dissatisfied.
|
|
Customer
Responsiveness
|
Response
to service requests*
|
95%
in 2014
|
4.7,
4.8.6
|
80%
of service requests responded to within 5 working days.
|
*
Level of Service measure required by Local Government Act 2002.
Strategies, studies, reports and surveys
The
following are planned for the next three years to enable and inform Council on
future decisions. These are identified in the table below:
|
Study/strategy
|
AMP Section Reference
|
2015/16
|
2016/17
|
2017/18
|
|
Parking
surveys
|
2.81,
4.6, 4.12, 5.10 App J
|
$50,000
|
25,000
|
25,000
|
|
Traffic
counting and monitoring
|
2.81,
App J
|
$50,000
|
$50,000
|
$50,000
|
|
Stoke
Foothills Traffic Needs Study
|
2.8.1,
App J
|
$100,000
|
|
|
|
Atawhai
Foothills Traffic Needs Study
|
2.8.1,
App J
|
$100,000
|
|
|
|
CBD
West Traffic Study
|
2.8.1,
App J
|
|
$100,000
|
|
As a result of the LTP deliberations and staff fine
tuning the methodology, the cost of parking surveys in 2016/17 and 2017/18 have
been reduced to $10,000 per year as only a representative sample of car parks
will be surveyed rather than the majority of the CBD. The Atawhai Hills study
has been moved to 2016/17. The CBD West Study has been moved to 2017/18.
Major new operation and maintenance activities
(2015/16 to 2017/18)
· $50,000 pa for the operation and maintenance of the
Stock Effluent facility;
· $100,000 pa for small
scale emergency works, response and recovery;
· An additional $200,000 pa for public transport.
Options include a potential increase the arterial route frequency and extending
the Stoke network coverage.
· In response to NZTA changing their
initial advice on the way emergency events would be funded, the emergency works
budget has been reduced from $200,000 to $100,000 per year cumulating.
Major new RENEWAL AND CAPITAL activities (2015/16 to
2017/18)
· Reseals budget of $1.33M/year due to the significant
number of sites where the seal has reached the end of its useful life;
· Increase the streetlight renewal budget to convert
aged fittings to LED’s;
· Earthquake strengthening of road bridges;
· New footpaths budget to close missing links and
provide footpaths on existing roads that have none;
· Increase structural replacement programme for the road
pavement;
· Todd Bush Road upgrade in 2015/16;
· CBD Nelson and Stoke Enhancement initiatives;
· Give effect to the outcomes of the Draft Parking
Strategy;
· Road upgrades with
walking and cycling network benefits in the Wigzell Park area;
· Projects included in the Regional Land Transport Plan,
including:
o Implement walking, cycling and schools package (includes
Rocks Rd, Tahunanui Network and the bridge across Saltwater creek on the Maitai
Path);
o Minor Improvements Budget of $650,000 pa.
Significant projects, (greater than $500,000)
proposed for the following seven years
· Implement the outcomes of the Stoke and Atawhai
Foothills studies;
· Complete the street upgrades in The Wood area;
· CBD Nelson and Stoke Enhancement initiatives;
· Give effect to the outcomes of Draft Parking Strategy;
· Marsden Valley Road / The Ridgeway intersection
upgrade – subject to investigation;
· Marsden Road / Main Road Stoke intersection upgrade
– subject to investigation;
· Marsden Valley Road Upgrade
· Rocks Road Plant and Food to Maitai Path - Walk Cycle
link
DEFERRED CAPITAL ACTIVITIES
Council,
in the 2012 AMP, refocused its capital expenditure priorities away from
upgrading local low traffic, low pedestrian and cycle volume roads that require
a high cost to upgrade (e.g. hillside road upgrades). It targeted investment to
maintaining the existing road infrastructure and contributing its local share to
the regionally funded projects identified in the Regional Land Transport Plan.
The remaining unsubsidised capital was prioritised on projects with significant
traffic volumes and / or safety issues.
Several
less urgent road upgrades identified in previous LTP's have been either
deferred or removed.
This AMP proposes to fund street and intersection upgrades
that provide walking and cycling network improvements such as the Wigzell Park
area north of the Hospital.
The Wigzell area improvements have been replaced with a
general “shared zone” project to the value of $100,000 per year
under the Work Category 341: Minor Improvements.
Key ASSET MANAGEMENT ISSUES
· Outcomes from the One Network Road Classification
(ONRC) framework that will drive national level of service consistency through
the NZ Transport Agency funding mechanisms;
· Outcomes from the Central region freight
analysis/study;
· Outcomes from the NBus review which include funding
and service levels;
· Deterioration of footpath surfacing due to increased
costs to meet desired level of service, resulting in less renewal length being
achieved;
· Outcomes from the Parking Strategy 2014;
· The updating of key transport policy documents;
o Structures on Road Reserve;
o Licence to occupy Road Reserve;
o Road Occupation Policy.
Key assumptions and uncertainties
As well as the general assumptions that apply across
Council’s work, assumptions specific to transport include:
· The National and Regional funding identified in the Draft Regional Land Transport Plan will be
supported in the National Land Transport Programme.
· The NZ Transport Agency financial assistance rates
will increase from the current 46% to 47% in 2015/16 and rise by 1% per annum
to 51% over five years.
· The NZ Transport Agency will co-fund the regions
passenger transport at an increased level from 2012-15 RLTP.
· Tasman District Council will contribute $80,000 per year to the Nelson / Richmond
passenger transport service which has been
confirmed in their LTP.
· Public transport patronage will be at a level that
continues to support the public transport level of service.
· Energy prices will not increase/decrease significantly
over the next three years with a consequent effect on vehicle use or shifts to
other modes of transport.
· The number of vehicles and vehicle movements per
household will continue at no greater than 2013 levels over the period covered
by this Asset Management Plan.
· Parking meter revenue is collected at a level of
$460,000 pa.
· That paid parking
in the CBD is applied other than during the winter months.
· Tasman District Council will continue to promote free
parking within Richmond.
· Free parking for
the first hour and an increase thereafter to the rate of $1.50 per hour
continues over the period covered by this Asset Management Plan.
·
1.1. Purpose
Council
manages activities and assets on behalf of the ratepayers of Nelson to a value
in excess of $1 billion. The assets are part of the city’s physical
infrastructure and are important because many public services rely upon them
and because they represent a significant investment by the community, built up
over the last 100 years and more. The activities are equally important, and
represent the way in which services are delivered to ratepayers.
The
Local Government Act 2002 and the Land Transport Management Act 2003 places a
legal obligation on Council to manage its assets to provide a specified
standard of service in a cost effective manner. Council has committed to
undertake this obligation in accordance with the Asset/Activity Management
Policy using Asset and Activity Management Plans.
1.2. Plan Structure
The
Plan is divided into two parts. Part 1 has four sections:
· Introduction;
· What are the future demand issues to consider?;
· What’s the direction?;
· The delivery of a balanced approach.
Optimised
delivery requires consideration of the transport network to enable the
financial forecasts to be developed. The second part contains a more detailed
analysis of the transport assets and activities, set out as follows:
· Asset Management Systems;
· Valuation;
· Financial Forecasts and Development Contributions;
· Risk Management;
· Performance Monitoring and Improvement Plan.
1.3. The Transport Activity
The
Transport services and assets associated with this activity are primarily
focussed on the safe, efficient and effective transport of people and goods
around the region. This includes the provision of physical infrastructure on
the road reserve such as for driving, parking, cycling and walking as well as
the provision of safety, traffic control and public transport services.
The
transport assets owned by Council include:
· The vehicle network (road pavements, bridges,
retaining walls);
· The cycle network (cycle lanes, shared paths, cycle
paths);
· The pedestrian network (footpaths, walkways, bridges);
· Infrastructure on road reserve (kerbs and channels,
sumps, storm water control, street furniture;
· Network control and management (traffic lights, signs,
line markings);
· Safety (streetlights, fences, guardrails);
· Parking (on and off street car parks, parking meters
and parking enforcement);
· Passenger Transport (bus services/stops, total
mobility services);
· The replacement cost of these assets is approximately
$700 million, and the depreciated value is $570 million.
1.4. The Stakeholders
Council
does not consult on its Asset Management Plans but does consult via the LTP,
Regional Land Transport Plan and individually on transport planning and
engineering projects and activities depending on the significance and location.
Below is a list of key stakeholders, key user groups and area specific user
groups that may be consulted to enable the implementation of this Plan.
1.4.1. Key Stakeholders
Key
stakeholders identified in this plan are:
· The community of Nelson, including Tangata Whenua
comprising six Iwi;
· New Zealand taxpayers who fund the co-investment
provided by the NZ Transport Agency;
· Other asset and activity user such as visitors and
tourists;
· The Ministry of Transport and the NZ Transport Agency;
· Tasman and Marlborough District Councils;
· New Zealand Police, fire and ambulance services;
· The Nelson Marlborough District Health Board;
· The Accident Compensation Corporation.
· The installers of ultra-fast broadband cables, power
and telecom lines.
· Other key users groups that may be identified on a
project by project basis.
1.4.2. Te Tau Ihu Treaty
Settlement Act 2014
The Te Tau Ihu Treaty of Waitangi Settlement Acts 2014 (the
Acts) for the eight iwi of Te Tau Ihu:
· Ngati Kuia,
· Rangitane o Wairau,
· Ngati Toa Rangatira,
· Ngati Koata,
· Ngati Rarua,
· Ngati Tama ki Te Tau Ihu,
· Te Atiawa o Te Waka a – Maui,
· Ngati Apa ki te Ra To
provide statutory obligations for Council in respect to
general decision making processes, and specifically in RMA process and decision
making. The Acts passed into legislation on the 1st of August 2014. Each Act
provides each of the eight iwi with redress for past grievances dating back to
1840 in the Top of the South with an apology from the Crown. There are three
types of redress provided for in the settlements as identified in Table 1.1
below. The redress that is shaded indicates that which are relevant to Asset
Management Plans and the LTP. Council will be working with the eight iwi of Te
Tau Ihu on relationships establishment and implementation of the settlements in
relation to Councils governance and decision making processes through the
2014/15 year. For asset management planning undertaken in 2014 Council has held
a workshop with iwi beginning a process of partnership and establishment of
good working relationships for managing areas of significance such as the
coastal marine area, freshwater bodies and catchments, reserves management and
heritage.
The Ngāti Kōata, Ngāti Rārua,
Ngāti Tama ki Te Tau Ihu, and Te Ātiawa o Te Waka-a-Māui Claims
Settlement Act 2014, Ngāti Apa ki te Rā Tō, Ngāti Kuia, and
Rangitāne o Wairau Claims Settlement Act 2014 and the Ngati Toa Rangatira
Claims Settlement Act 2014 (The Acts) provides statutory obligations for
Council in respect to general decision making processes. The Acts are the
culmination of Central Government’s resolution of claims lodged by the
eight iwi for redress of past wrong’s and provides for Cultural,
Relationship and Financial redress.
Statutory acknowledgments may impact works
programmes within the Asset Management Plan and the eight iwi will potentially
be considered as affected parties under section 95E of the Resource Management
Act, which the settlement legislation provides for.
Table 1.1 Te
Tau Ihu Settlement Bill Proposed Redress
|
Note: Items relevant to asset management planning are
shaded.
|
|
Cultural
Redress
|
Statutory
kaitiaki over a number of Department of Conservation administered Crown lands
and the Coastal Marine Area
|
|
Vesting
of sites in iwi ownership
|
|
Overlay
classifications which require the Crown to acknowledge iwi values in that
area
|
|
Statutory
acknowledgments and deeds of recognition which are recognised under the RMA
1991 and Historic Places Act 1993
|
|
Statements
of association, place names changes, crown payment, pouwhenua and mineral
fossicking rights
|
|
Relationship
Redress
|
Promotion
of the relationship between iwi and local authorities of Te Tau Ihu
|
|
Protocols
which encourage good working relationships on matters of cultural importance
to iwi
|
|
Letters
of introduction to museums and film archives
|
|
River
and freshwater advisory committee to be set up and provide input into local
authority decision making in relation to the management of rivers and
freshwater under the RMA 1991
|
|
Memorandum
of Understanding between iwi and the Department of Conservation
|
|
Financial
Redress
|
Financial
settlement
|
|
Commercial
redress which involves properties being purchased by iwi and then leased back
to the Crown, and first right of refusal over a number of properties
|
1.5. The End Users
The
end users of this plan are the Council staff in the transport asset management
and operations departments. They will use this plan to manage the city’s
assets and activities on the road reserve in a cost effective, sustainable,
well planned and coordinated manner to provide agreed levels of service.
This
document is also part of the business case to support the RLTP for the local
road component and assists in informing the LTP.
1.6. The Legislative Context
The
overall legislative framework for planning, funding and managing the land
transport system includes Acts, Regulations and Rules, a list of these
fundamental to transport are provided in Appendix A.
1.7. Strategic Context
1.7.1. Government Outcomes
Forward
Plan for Transport
The
government’s policy direction for transport over the next decade is
outlined in “Connecting New Zealand”, published August 2011. This
publication is still very relevant as government policy has not changed
significantly since 2011 but it does still refer to the previous Government
Policy Statement. The publication identifies the big issues for transport
systems as being:
· Population growth;
· Ageing population;
· Global freight growth;
· Fuel prices and volatility;
· Transport emissions;
· Transport security; and
· New technology.
The
publication clearly identifies that central government is responsible for
responding to issues that are beyond its direct control, such as oil prices,
ageing population and the effects of climate change, and that local government
is responsible for regional and local transport planning and delivery.
A
fundamental policy evident from the publication is that the government wants
the costs associated with transport choices to be as clear as possible, and for
the price of using each mode to match actual cost as much as possible. This
will enable businesses and individuals to make the transport decisions that
best meet their needs.
The
publication provides a reality statement in regard to travel demand management
initiatives and their effectiveness in relieving congestion. It states
“We need to make sure that the arteries of our cities do not become
clogged and that access to our key rail hubs, air and sea ports remain free
moving, and that the corridors along our key supply chains also remain
protected from congestion. In some cases, the government is taking a lead
infrastructure approach to land transport investments, leading improvements in
capacity ahead of them being required to encourage economic growth. In doing
so, the government is being careful to respond to predicted incremental changes
in transport demand and trends, rather than seeking wholesale mode shift for
non-economic reasons. The latter would lead to a deadweight economic loss by
encouraging inefficient transport choices.”
The
publication also reiterates the governments focus on delivering value for
money, it states “Improving performance and productivity right across the
public service is a high priority for the government, including the transport
sector. The government needs to be confident that the transport sector (central
and local government in particular) is delivering the right infrastructure and
services to the right level and for the best possible price.”
Government
Policy Statement 2015/16 to 2024/25
The
Government Policy Statement on Land Transport Funding is issued by the Minister
of Transport every three years. It sets out the government’s priorities
for expenditure from the National Land Transport Fund over the next 10 years.
The
Government Policy Statement influences decisions on how money from the National
Land Transport Fund will be invested in activity classes, such as state
highways and public transport. It also guides the NZ Transport Agency and local
government on the type of activities that should be included in regional land
transport plans and the National Land Transport Programme. Regional Land
Transport strategies must take account of the Government Policy Statement and
Regional Land Transport plans must be consistent with the Government Policy
Statement.
The
Draft Government Policy Statement
2015 broadly continues the overall direction set by the Government Policy
Statement in 2012 & 2009 and contains three priorities:
· A strong and continuing focus on
economic growth and productivity – The government’s investment in land transport
should support increased economic growth and productivity in New Zealand.
· Value-for-money – Land transport services
should be delivered better and smarter. Asset management will be improved to
boost performance of roading infrastructure. The Government Policy Statement
2015 makes it clear that getting more out of what is spent is expected.
· Road safety – Road safety is a transport
priority for the government. Safer Journeys, the Government’s road safety
strategy, will be supported through the next National Land Transport Programme.
·
1.7.2. NZ Transport Agency
Outcomes
The
NZ Transport Agency has identified the impacts it wishes to deliver through the
implementation of its investment and revenue strategy. These are:
· better use of existing transport capacity;
· more efficient freight supply chains;
· a resilient and secure network;
· easing of severe urban congestion;
· more efficient vehicles;
· reductions in deaths and serious injuries;
· more transport mode choice; and
· reduction in adverse environmental effects from land
transport.
1.7.3. Council’s
Strategies, Plans and Policies
Nelson City has a
well-developed set of strategies and policies relating to the city’s
environment, its land use and transport systems, and its community. A summary
of these is provided in Appendix B. The present suite of relevant documents has
been developed over the past two decades, in line with statutory and associated
requirements. Some of the separate strategies are not binding in a statutory
sense, but help to elucidate the Council’s intended directions or
approaches.
The
strategies and policies have been developed with significant community input,
and can be said to reflect the directions which the community wishes to follow
to achieve the City we want Nelson to be.
Council-supplied
transport infrastructure and transport planning contributes to achieving the
following Council Community
Outcomes:
Table 1.2 Council Community Outcomes
|
Outcomes/Goals
|
How transport contributes to achieving the outcome goals
|
|
Our unique natural environment is healthy and protected.
|
Through providing a range of transport modes that minimise
the impact on the environment.
|
|
Our urban and rural environments are people-friendly, well
planned and sustainably managed
|
Through taking into account the impact on public spaces when
providing transport infrastructure.
|
|
Our infrastructure is efficient, cost effective and meets
current and future needs
|
Optimisation of both maintenance and renewal expenditure is
undertaken to ensure the least cost for the whole of the assets life.
Through providing an effective and efficient transport
system that meets the needs of residents and businesses.
|
|
Our communities are healthy, safe, inclusive and resilient
|
Through providing a safe and resilient transport network
that provides for all modes.
|
|
Our communities have opportunities to celebrate and explore
their heritage, identity and creativity
|
The transport asset provides the space and means to allow
our community to interact.
|
|
Our communities have access to a range of social,
educational and recreational facilities and activities.
|
The transport asset provides the space and means to allow
our community to interact.
|
|
Our Council provides leadership and fosters partnerships, a
regional perspective, and community engagement
|
Through providing a transport network that takes account of
our regional placement. Through engaging with our community as the
transport network is developed.
|
|
Our region is supported by an innovative and sustainable
economy
|
Through providing an effective and efficient transport
system that meets the needs of residents and businesses.
|
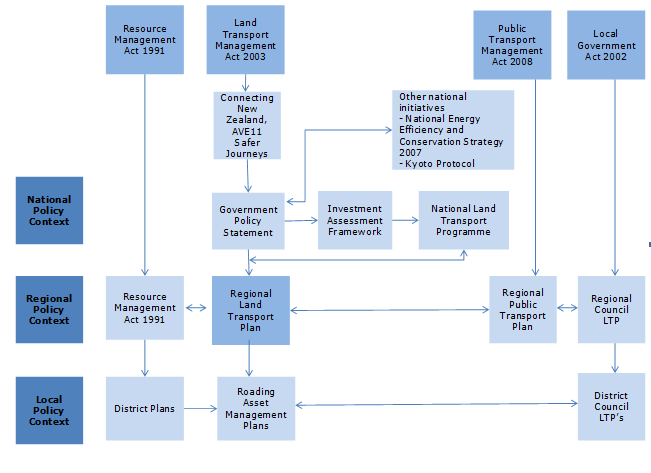
1.7.4. Linkage Diagram to
Planning Documents
Figure 1.1 Relationship
between Statutes and Policy Documents
2. WHAT
ARE THE FUTURE DEMAND ISSUES TO CONSIDER?
There
are several demand drivers that need to be taken into account when considering
the future delivery of transport assets and activities. The development of a
number of strategic documents, studies and models has enabled access to a vast
amount of knowledge on several of the key demand drivers in Nelson and it is
not intended to repeat the data contained within those documents in this plan.
The demand drivers, document names, source reference and relevant notes are
provided in Appendix C. Within these documents data on population, traffic,
heavy commercial vehicles, port cargo, airport use, walking, cycling, passenger
transport, travel demand management, fuel price rises, sea level rise and
funding are provided.
The
Arterial Traffic Study, which is the most comprehensive transport study
undertaken in Nelson in recent years, provides a definitive assessment of the
demand issues for the region and a comprehensive analysis for each mode, given
expected population growth and the region’s demographics.
An
overview of the documents in Appendix C indicates the following key trends,
although it needs to be emphasised that future environmental, economic and
social shocks have the potential to significantly alter these trends:
Population
Nelsons population is expected to grow as shown in Figure 2.1
below. This information is based on population projections by Statistics New Zealand published
on 19 February 2015, using Census 2013 demographics and trends as a base
(2013-based). The medium growth series has been used as Statistics New Zealand
advised at the time that the medium projection is considered suitable for
assessing future population change.
Nelson’s
population is expected to grow by 5,000 3,600 over the next ten years, to almost
55,000 53,320 residents in 2025.
Continuing the present trend, over half of the growth will be driven by
increasing population in Stoke, and the
populations in Nelson Central, Nelson North and Tahunanui are also expected to
increase. about a quarter is from Nelson Central.
· An ageing population with an increasing median age and
an increasing proportion of older people
· The proportion of the
population aged under 15 years will decrease after 2018, from 18% to 16% in
2025 and to 15% by 2045. The number of children is likely to keep increasing
until around 2025
· Smaller households with an increase in one-person
households
Population
growth is expected to slow down after 2025, resulting in an increase of 4,700
residents over the 20 years between 2025 and 2045, to almost 60,000 in 2045.
Most of the growth in these later years is again driven by an increasing
population in Stoke but the rest of Nelson (Nelson North, Nelson Central and
Tahuna) are also projected to have increasing populations.
Congestion
The
Arterial Traffic Study determined that overall there is likely to be a 26-28%
increase in peak hour trips in the next 30 years, a reduction in average trip
length and an increase in interpeak and off-peak directions along the current
arterial routes and little or no increase in peak direction traffic.
Traffic
count data collected since late 2009 provides detail as to the distribution of
trips throughout the day and by direction on the key arterial routes. This data
shows that in general, traffic volumes on Rocks Road and Waimea Road in the
busiest direction (northbound in the AM peak and southbound in the PM peak)
have remained flat or slightly decreasing. In the opposing direction traffic volumes
during these times traffic volumes have increased. During the midday peak the
traffic volumes travelling into Nelson have remained static and reduced in the
Richmond direction.
The
data collected for Main Road Stoke is at a location south of Saxton Road. That
data shows the traffic volume on this arterial route is generally trending
downwards in the southbound direction and is static to slightly decreasing in
the northbound direction.
Refer
to Appendix D for traffic flow data on the main arterials.
Car
trips
· Overall car trips per capita have remained flat or
decreased over the last three years. This has resulted in a corresponding
reduction in arterial traffic volumes, refer Appendix D for traffic flow data
on the main arterials.
Freight
The
National Freight Demand Study 2014 predicts growth in freight movements from
18.6 million tonnes in 2012 to 28.04 million tonnes in 2042 for the
Nelson/Marlborough/Tasman region. This corresponds to an average annual growth
rate of around 2%. That Freight Demand Study also highlighted a peak log
harvest for the Nelson Marlborough Tasman area in the 2020 – 2025 period
of double the current tonnage.
Passenger
Transport
· Modelling undertaken for the arterial traffic study
indicates low patronage uptake unless there is a significant increase in
vehicle use costs (i.e. fuel prices and/or parking charges). There has been
strong growth in demand for public transport over the last three years but this
is expected to plateau in the medium term without further increases in the
route frequency or coverage.
Walking
· The results of the 2014 Residents Survey show that
around 8% of residents walk to work. This percentage has dropped over the last
four years from 10%, refer Appendix D for historic pedestrian counts.
Cycling
· Records show an 8-9% growth per year over the last
three years, although it is uncertain whether this growth can be sustained.
Refer Appendix D for historic pedestrian counts.
Demographic
Change
· Census data indicates that generally
the region’s population is ageing, over half of Nelsons population growth
was in Stoke and the local demographic profile includes a “gap” in
the 15 to 40 year cohorts (such trends are found nationwide with the gap being
typical of provincial cities). This is likely to contribute to more off-peak
journeys and slightly reduced traffic growth over time, due to the travel
patterns of the growing number of older people and an increasing demand for
services for the over 65 years age group, i.e. improved total mobility services
and footpaths and shared paths designed for the sight impaired and those who
use mobility scooters.
·
Figure 2.1 Projected
Population and Households Growth

Forecasting
Assumptions
The
Council produces a LTP every three years to set the strategic direction for the
city over the following ten years. It enables integrated decision-making, land
use planning, infrastructure and facilities development, environmental
protection. It outlines how Council will provide services as the population
increases and summarises Council’s financial allocation and
prioritisation process.
Forecasting
assumptions are crucial to gaining the right direction and use of public funds.
Forecasting for growth considers three key components being population growth,
growth in property and growth in economic activity. For transport the Council
records the relevant assumptions within the transport activity in the LTP.
2.1. Arterial Traffic
The
development of the city’s State Highway and arterial network has been a
fraught process over recent years. A 1967 study originally mooted a highway
between Nelson city and Richmond to relieve forecast traffic growth along Main
Road Stoke, Annesbrook, Tahunanui, Rocks Road and Waimea Road, bypassing Stoke
on the seaward side and heading over the Bishopdale hill down the railway
reserve where the railway lines were lifted in 1955.
In
2001 the first half of this highway, bypassing Stoke, was completed by Transit
New Zealand and named Whakatu Drive. The second part, known most notably as the
Southern Link, was rejected by the Environment Court in 2004 and led to the
commissioning of the joint NZ Transport Agency, Nelson City Council and Tasman
District Council study of the wider Nelson – Richmond transport issues,
known as the North Nelson to Brightwater Strategic Study in 2008.
This
culminated in a long term vision to 2026, including a combination of public
transport, cycling, traffic management and travel demand management measures to
support road improvements. No final decision was made on this strategy;
consequently in 2009 the Nelson Regional Transport Committee completed the
draft Regional Land Transport Strategy which acknowledged a need for additional
road capacity as well as a significant improvement in public transport services
in the region. The railway reserve was acknowledged as a logical potential
transport corridor if ever required.
In
2009 - 2010 NCC undertook the Arterial Traffic Study to determine the best
transport option between Annesbrook and QE11/Haven Rd roundabouts that would
improve the City as a whole.
The
Arterial Traffic Study was a significant piece of work completed in 2011 to
enable a better understanding of short to medium term demand issues as they
relate directly to Nelson. The outcome has a fundamental bearing on how network
growth is addressed in the region. Essentially the Arterial Traffic Study, in
agreement with the NZ Transport Agency, determined that:
· There is not a significant traffic problem in Nelson,
nor is one forecast to develop over the modelled time period of the study
– the next 25 years.
· Of the four options that were assessed in the study
Option A - Peak Hour Clearways and Option B – Southern Arterial both
offered positives but also had negatives.
· Elements of Option A can be done in stages to provide
additional capacity when needed, for example – the study recommended
progressing the walk/cycleway around the waterfront in the short term.
· Option B – the Southern Arterial route should be
protected as a long-term future dedicated transport corridor should things
change.
The
Council considered the Arterial Traffic Study and preferred the Southern
Arterial Corridor as the best long term transport option route. NCC officers
were directed to prepare an issues definition report assessing the options
available for protecting the Southern Arterial Corridor. The Corridor
Management Plan was completed in late 2013.
Following
the National Election in 2014 the Government announced that they would
investigate the Southern Arterial Corridor using their Future Investment Fund.
2.2. Accessibility
Accessibility
can be viewed as the "ability to access" and often focuses on people
with disabilities or special needs and their right of access, although it is
universal and impacts on us all whether we are young, old, rural, urban,
able-bodied or have a disability.
The
needs of all sectors of the community should be considered when designers
maintain and build Council’s infrastructure.
Typical
issues that have been raised by the accessibility sector for which demand for
action by Council is growing include:
· Quality of some footpaths and crossing points which
cause barriers for pushchairs, mobility scooters and wheelchairs;
· Lack of appropriately located parking spaces for
mobility impaired
· Lack of footpaths on some roads;
· Poor pedestrian crossing facilities on the following
main transport corridors - Rocks Road, Annesbrook Drive, Waimea Road, Nayland
Road;
· Council has recently formally joined the regional A4A
(Accessibility for All) forum where regional accessibility issues can be raised
and improvements considered. Council has also recently made a significant
improvement in the routes and frequency of public transport which will improve
accessibility for many Nelson residents.
2.3. Sustainability
2.3.1. Overview of
Sustainability
The Local Government Act 2002 sets out principles that
local authorities must act in accordance with. The legislation requires local
authorities to ensure prudent stewardship and the efficient and effective use
of its resources in the interests of its district or region; and in taking a
sustainable development approach, take into account:
· The social, economic, and cultural interests of people
and communities; and
· The need to maintain and enhance the quality of the
environment; and
· The reasonably foreseeable needs of future generations
In 2011 Council began work on a 50 year vision of what
Nelson could become, using sustainability principles. The vision statement was
adopted in the LTP 2012-22 and the full Strategy in 2013. It identified ten
goals that the Nelson community said were priorities for action and Council is
now working to ensure that these goals and sustainability principles are integrated
into all the decisions made about its activities.
Sustainable development actions and approaches are
embedded throughout this asset management plan. These include the following:
Goal
3
Our
natural environment – air, land, rivers and sea – is protected and
healthy
· The Balanced Approach to managing the transport assets
moves the emphasis away from purely providing increasing road capacity. The
emphasis is instead on providing for an appropriate mix of transport modes
while maximising the efficient operation of the road assets we already have.
The continued funding and resulting growth in NBus use contributes to a
reduction in vehicle emissions, especially in the slower moving air sheds
around Stoke, Victory, Hospital and Bishopdale areas.
· The focus on providing improved safety for pedestrians
and cyclists has the effect of encouraging use of these transport modes further
and in turn also contributing to a reduction in vehicle emissions.
Goal
5
We
are able to rapidly adapt to change
· Programmed for year two of this AMP, the Atawhai Hills
transport study is at least partially focussed on increasing the resilience of
the road network between the northern suburbs and the Nelson CBD.
· Constant monitoring of the traffic conditions and the
split of mode choice will enable us to monitor trends in key performance
indicators and allow us to respond early to any emerging issues. As detailed in
the Improvement Plan improvements to how this data is collected and analysed
are planned in the next three years.
Goal
6
We
move from using fossil fuels to renewable energy sources
· As with Goal three, the investment in the alternative
transport modes of cycling, walking and public transport encourages their use.
In turn any growth in use of these modes reduces use of fossil fuels.
Goal
9
Everyone
in our community has their essential needs met
· There are three main groups within the Nelson
community that are transport disadvantaged; the youth, elderly and those at the
lower end of the socio-economic spectrum. The ongoing provision of the NBus is
targeted at meeting this essential need for this group of the community.
Councils
approach to its transport network has taken a “sustainable”
approach since the development of the 2009 Regional Land Transport Strategy.
That strategy supported increasing walking, cycling and passenger transport
travel choices, and placed a reduced emphasis on providing for future traffic
growth. The direction started in the Regional Land Transport Strategy has been
continued in this Asset Management Plan by rebalancing spending to projects of
need, which maintains the existing transport infrastructure and increase mode
choice and safety, rather than pursuing uneconomic low value for money
projects. It has also included whole of life assessment of the transport assets
and the development of long term management strategies to protect the life of
the asset to maximise value for money and investment.
2.4. Environmental
Risks
Environmental
risks include earthquakes, heavy rainfall, slips and storm surges. Council does
not specifically fund large scale
environmental risks for roading but has acknowledged that it will be required
to increase loan funding to pay for 30 to 50
percent half of the cost to repair the roading infrastructure
should a large scale event occur. The NZ Transport Agency funds the balance other half through the National
Land Transport Fund.
An
assessment of the roading bridges has been undertaken and those on lifeline
routes up the Maitai and Brook valleys are prioritised for seismic
strengthening subject to NZ Transport Agency funding approval to secure access
to the city water supply infrastructure.
2.5. Regional
Considerations
There
are several differences in the way Nelson manages its Transport Network
compared to Tasman. It is important to recognise those differences to enable an
understanding of the extent to which they affect the Nelson network and
community.
Nelson
views the provision of improved passenger transport services as essential in
providing greater mode choice but also as a means of reducing peak hour
congestion between Nelson and Richmond. The cooperation and support of
passenger transport by Richmond‘s residents and governing bodies is
important if Nelson is to achieve efficient and resilient connectivity with its
nearest regional centre. Recently the two councils have been working together
to achieve this. Tasman District Council have included a $80,000 pa allowance in their LTP and 2015-2025 Asset Management Plan to
assist in funding the bus service.
There
are differences between Nelson and Richmond parking policies which implies a
more fundamental philosophical difference in transport policy between the two
regions. The funding of passenger transport and the charging and restricting of
parking are essential tools in managing the transport network to influence mode
choice.
Another
regional consideration is the allocation of Nelson’s “R”
funding. Currently the NZ Transport Agency has confirmed that it is to be spent
within the “region”, and will be spent on the highest ranking
projects in terms of NZ Transport Agency’s investment and revenue
strategy. This effectively means that Nelson projects are competing for
priority with NZ Transport Agency’s state highway projects.
There
are likely to be differences in the way Nelson manages its transport assets
compared to Tasman as, being a city, it has to deal with different issues. This
is probably reflected most in the Land Development Manual, footpath resealing
policy, capital works prioritisation method, cycling and walking policies,
Regional Passenger Transport Plan, Regional Land Transport Plan, minor safety
polices, street lighting, and growth management strategies.
2.6. Funding
Financial
Assistance Rates are used to determine what portion of a project or programme
could be funded from the National Land Transport Fund, which is administered by
the NZ Transport Agency through the National Land Transport Programme.
In
2013 and 2014 the NZ Transport Agency reviewed the principals and methods used
in setting the FAR. Recently the NZ Transport Agency advised there will be one
rate for all activities and that Nelson’s FAR will increase.
Nelson’s current effective FAR for all activities was 46%. For the
2015/16 year the NZ Transport Agency has confirmed
indicated that the FAR will be 47% and will rise by 1% per annum
to 51% over five years. The table below details the FAR that Nelson will
receive for each year from 2015/16:
Table 2.1 NZ
Transport Agency Financial Assistance Rates
|
Financial Year
|
Financial Assistance Rate
|
|
2014/15
|
46%
|
|
2015/16
|
47%
|
|
2016/17
|
48%
|
|
2017/18
|
49%
|
|
2018/19
|
50%
|
|
2019/20
|
51%
|
Council
have a risk sharing arrangement with the NZ Transport Agency whereby elevated
funding assistance rate for emergency works of subsidised assets. Recent preliminary advice indicates that The subsidy would available only for out of ordinary
short duration natural events that have a recovery and reinstatement cost
greater than $100,000 .
NZ Transport Agency have yet to announce the FAR for emergency
works. Their preliminary advice is that it may be 10% above the standard FAR.
The funding assistance rate that applies to emergency works
within each financial year is:
· For cumulative claims the total costs
of emergency works up to 10% of the total cost of the subsidised maintenance
programme for the year, the normal FAR
· for the part of cumulative claims of
total costs of emergency works that exceeds 10% of the approved maintenance
programme for the year, the normal FAR. plus 20%.
In
2012 The NZ Transport Agency advised that due to national financial constraints
the ‘R’ funding can be spent up to 2018 rather than 2015.
There
are several other sources of funding to support the Transport network along
with NZ Transport Agency co-investment and rates. These are Development
Contributions, private / public partnerships, utilisation and expansion of
parking revenue (which has been contributing towards cost of democracy for last
20 years).
Council’s
Development Contributions Policy does not permit contributions from growth on
roads classified as local although many of Council’s projects are
designed to cater for future growth, through providing walking and cycling
infrastructure on local roads. Previous roading policy determined that 20% of
network usage was attributable to growth when a new road is built or upgraded.
It is suggested that this proportion of growth could be applied to all new
roads and roading improvements, not excluding local roads as these are more
likely to service growth areas. It is also proposed that development
contributions should also be taken, at the same proportions for walking,
cycling and passenger transport infrastructure. These proposals are now being
considered in the Development Contributions Policy review.
Council’s new Development Contributions Policy,
adopted as part of the LTP process, has included projects on all road
classifications.
2.7. Funding
Risk
There
are already several transport activities that Council funds from rates without
any co-investment. As investment rules tighten, Council always has the option
of continuing with the activity or improving the level of service for an
activity by increasing the activities funding from rates. If Council chooses to
increase rates funding then The NZ Transport Agency will view the activity as
affordable by Council and will be unlikely to ever fund that activity to a
greater extent again.
The
NZ Transport Agency, like Council, works on a three year funding cycle. The NZ
Transport Agency allocates funding through the National Land Transport
Programme which it adopts in July 2015, after considering each regional land
transport plan. There is a risk that activities which may be eligible for
funding, and budgeted to receive funding in the LTP, are declined funding after
the Council has adopted its LTP. This will mean that some activities will have
to be reconsidered by Council to decide if additional funding is provided, or
the projects are postponed.
This
risk has been a key component on some local projects in recent years where
there has been uncertainty over a project receiving co-investment due to delays
in approvals, leading to confusion, especially when community engagement is
required early on in the design of a project.
2.8. Transport
Network Resilience
The
Regional Land Transport Plan aims to maximise the efficiency of the transport
system with minimal expenditure through encouraging the community to shift to
more sustainable ways of moving around the City. This concept is developed
further in the next section, resulting in a proposed balanced approach (Section
3.5) to managing the transport network.
Other
aspects of a communities resilience relies on Council’s other strategic
documents such as sustainability strategy, social wellbeing policy and, of
critical importance, it’s long term growth strategy implemented through
the resource management plan.
2.8.1. Planning for Growth
Growth
is planned for in a number of ways. The most formalised process is through
Resource Management Plan Changes.
Investigation
has been recently completed on a number of transport issues that are related to
future growth, these are:
· Nelson City Council / NZ Transport Agency / Tasman District
Council 3 roundabouts project;
· Parking Strategy;
· Southern Transport Corridor - Issues Definition
Report;
· Rocks Road walk and cycle investigation;
· Waimea Road Enhancement Study and intersection
improvements;
· Tahunanui Cycle Network.
Investigation
is planned for the following:
· Stoke Foothills Transportation Study –
investigation into intersection and surrounding network to accommodate growth
in the Stoke foothills;
· Atawhai Hills Transportation Study - investigation
into intersection and surrounding network to accommodate growth in the hills to
the north of the City;
· Annesbrook / Parkers and Quarantine Road modelling
[Discuss status with NZ Transport Agency]
· CBD West intersection modelling update - scheduled for
Year 3.
2.8.2. Building for Growth
Council
is concentrating on providing services to areas that are zoned for development
(Residential, Rural Zone High Density Small Holdings, Suburban Commercial and
Industrial) but are covered by the Services Overlay because one or more servicing
constraints have been identified as needing to be addressed prior to the
development of that property / area. The projects to facilitate future growth
identified in this AMP therefore only
consist of works required to eliminate servicing constraints on sites zoned for
development and these have been prioritised in accordance with Council’s
strategic planning process.
The
projects identified in the Asset Management Plan which have a substantial
growth component (>50%) are identified below, along with the years they are
programmed:
· 2023/24, Marsden Valley Road / The Ridgeway
intersection – subject to investigation;
· 2023/24, Marsden Road / Main Road Stoke intersection
– subject to investigation;
· 2022/25, Marsden Valley Road Upgrade;
· 2015/16, Todd Bush Road;
· 2021/22, Lucas
Terrace Upgrade.
Council resolved
during the LTP and Development Contributions Policy deliberations to bring a
minor improvement for Marsden Valley Road / The Ridgeway forward to 2015/16.
This does not have any budget implications as the rest of the projects in the
minor improvements database will be reprioritised.
The Lucas Terrace
Upgrade was removed from budgets as this upgrade will be funded by the
developer as the development is the only benefactor.
2.9. Consultation
The
Council recognises that it has obligations to seek the views of the local
community on issues, plans and strategies that may directly or indirectly
affect them. It also wants to encourage best practice by engaging public
involvement for transport schemes in order to create a sense of ownership by
local residents and to ensure that residents, businesses and stakeholders have
the opportunity to provide valuable input.
Additional
budgets have been included in all transport schemes to provide public
engagement. This is to ensure the Council makes informed decisions and that
Stakeholders are getting value for money. Views will be considered and
responded as is appropriate. We will provide information regarding the outcome
of the decision making process and the reasons for the decision.
Key
principles of public engagement that the Council wish to improve on, are
building consultation into the planning process from the start, and providing
access to information by various means to cater to the needs of all people.
2.10. Procurement Strategy
This
Strategy documents Nelson City Council’s approach to procurement of
activities funded through the National Land Transport Programme.
The
Strategy aims to achieve desired outcomes and quality at the lowest overall
whole of life cost and sustain a pool of suppliers in the region of varying
sizes and capabilities to meet the needs of the Council.
The
objectives of this Procurement Strategy are:
· To attain value for money;
· To encourage competitive and efficient markets;
· To enable fair competition;
· To operate an efficient procurement process.
Maintenance
contracts have been reviewed and grouped to provide a good balance between
price and quality, and use either prequalification or price/quality supplier
selection methods. The methods used to procure capital projects will differ
depending on the size of the project, but will be either lowest price or
price/quality.
Council
maintains an in-house professional services capability balanced with external
consultants as required to achieve best value for money. Additional
professional services are sometimes required and will be procured following the
guidelines of the NZ Transport Agency Procurement Manual whereby a supplier
will be directly appointed for contracts under $100,000, and a closed contest
will be used for work between $100,000 and $200,000. The supplier selection
method will be determined depending on the services being procured, but will
commonly be price/quality.
2.11. Prioritisation
Process for Projects
The
Council recognises that it has obligations to seek the views of the local
community on issues, plans and strategies that may directly or indirectly
affect residents. It also wants to encourage best practice by engaging public
involvement for transport schemes in order to create a sense of ownership by
local residents and to ensure that residents, businesses and stakeholders have
the opportunity to provide valuable input.
Projects
identified for funding in the Regional Land Transport Plan are subject to
prioritisation through the Regional Land Transport Plan development process.
This relies on the NZ Transport Agency investment and revenue framework.
3.1. Context
The
Transport Asset Management Plan has to take long term higher level direction
from the GPS and short term direction from the Regional Land Transport
Strategy. The long term vision and mission underpinning the Regional Land
Transport Strategy is:
“A sustainable transport future for
Nelson”
and
“To have a land transport system that is safe,
efficient, integrated and responsive and that meets the needs of the region in
ways that are environmentally, socially and economically sustainable”.
The
Draft Regional Land Transport Plan
2015 – 2021 (under development)
sets out the subsidised transport priorities for the next three years that
contribute to the vision for the region in accordance with the GPS on Land
Transport.
The RLTS has been superceded by the 2015-2021 RLTP. The
objectives contained in the RLTP are split into regional and local objectives
as follows:
|
GPS
Objectives
|
Regional
Objectives
|
Policy/Direction
|
Measures
of success for our communities
|
|
A land
transport system that addresses current and future demand
|
1) A
sustainable transport system that is integrated with well planned
development, enabling the efficient and reliable movement of people and goods
to, from and throughout the region
2)
Supporting economic growth through providing better access across the Top of
the South’s key journey routes
|
Target
investment in regional route improvements to key journey routes
Consider
Top of the South options to collaborate and improve road operations and maintenance
delivery mechanisms
Target
investment in projects that reduce travel times and vehicle operating costs
on key journey routes
Develop and
apply ONRC transition plans and programmes to close the Customer Level of
Service gaps
|
Travel
times between SH 6/60 and Port Nelson, and on SH1 between Picton and the
Marlborough boundary are consistent
Reduction
in the distance per capita travelled in single occupancy vehicles
ONRC is
fully established by 2018
Routes
available to HPMV increase over time
|
|
A land
transport system that is reliable and resilient
|
3)
Communities have access to a resilient transport system
4)
Communities have access to a reliable transport system
|
Reduce the
risk of disruption on lifeline routes
Improve
network resilience along key journey routes
Improve
network reliability along key journey routes
|
Reduction
in the number of hours that sections of the key journey routes are closed due
to unplanned disruptions
Travel time
variability on our key journeys does not increase
|
|
GPS
Objectives
|
Nelson
Objectives
|
Policy/Direction
|
Measures
of success for our communities
|
|
A land
transport system that addresses current and future demand
|
1) A
sustainable transport system that is integrated with well planned
development, enabling the efficient and reliable movement of people and goods
to, from and throughout the region
2)
Supporting economic growth through providing better access across the Top of
the South’s key journey routes.
|
Target
investment in regional route improvements to key journey routes
Consider
Top of the South options to collaborate and improve road operations and
maintenance delivery mechanisms
Target
investment in projects that reduce travel times and vehicle operating costs
on key journey routes
Develop
and apply ONRC transition plans and programmes to close the Customer Level of
Service gaps
|
Travel
time variability on SH6 and Waimea Road are consistent
Reduction
in the distance per capita travelled in single occupancy vehicles
ONRC is
fully embedded by 2018
Routes
available to HMPV increase over time
|
|
A land
transport system that is reliable and resilient
|
3)
Communities have access to a resilient transport system.
4)
Communities have access to a reliable transport system.
|
Reduce
the risk of disruption on lifeline routes
Improve
network resilience along key journey routes
Improve
network reliability along key journey routes
|
Reduction
in the number of hours that key journey routes are closed due to unplanned
disruptions
Travel
time variability on SH6 and Waimea Road are consistent
|
|
A land
transport system that provides appropriate transport choices
|
N1)
Communities have access to a range of travel choices to meet their social,
economic, health and cultural needs
N2)
Enable access to social and economic opportunities by investing in public
transport
|
Extend
walking and cycling networks and improve urban routes for cyclists where this
can be achieved at reasonable cost
Maintain
and grow public transport patronage by reconfigured and extended networks and
improved ticketing methods
|
Increase
in total trips travelled by walking, cycling, and public transport at peak
times
Increase
in total trips travelled by walking, cycling, and public transport
|
|
A land
transport system that appropriately mitigates the effects of land transport
on the environment.
|
N3)The
transport system supports national strategies for energy efficiency and
climate change, and protects natural systems and community values
|
Invest
in local environmental mitigation measures with investment targeted on the
most adverse cases
Invest
in methods to reduce fuel related vehicle operating costs
Invest
in travel demand management measures and infrastructure that enables more
efficient trips
|
Reduction
in the distance per capita travelled in single occupancy vehicles in Nelson
Increase
in total trips travelled by walking, cycling, and public transport at peak
times
Increase
in total trips travelled by walking, cycling, and public transport
|
|
A land
transport system that is a safe system, increasingly free of deaths and
serious injury
|
N4)
Deaths and serious injuries on the Nelson network are reduced at reasonable
cost
|
Adopt a
‘Safe System Approach’ to road transport
Ensure
road safety audits are undertaken on new roads or improvements to roads
Safety
budgets targeted to improvements that deliver road safety improvements with a
focus on reducing deaths and serious injuries.
Increase
safe cycling through improvement of cycle networks
|
Reducing
trend in deaths and serious injuries on the transport network
A flat
or declining number of cycle crashes on the network
A
declining number of pedestrian crashes on the network
|
3.2. What Are
The Impacts of Moving People and Goods?
While
the transport services and assets associated with this activity are primarily
focussed on the safe, efficient and effective transport of people and goods
around the region it is important for Council to recognise the potential
negative effects on the community. Briefly these are summarised as:
Economic
· The economic cost resulting from road congestion;
· The economic cost resulting from operating,
maintenance, renewal and investing in transport assets and services;
Environmental
· Air, water and particle pollution from motor vehicles;
· Disturbance of the natural environment from road
construction;
· Contribution to climate change.
Social
· Noise and community severance from busy roads;
· Social cost of road congestion, accidents and
injuries;
· Health effects from transport infrastructure which
either inhibits, or does not promote, physical activity.
3.3. A
Brief History of Street Design and Improvements Programme
Historically
transport development in Nelson has pursued infrastructure improvements that
have primarily focussed on catering for predicted future traffic volumes. The
greatest contributor to the city’s roading network has been through
residential and industrial growth. The progressive standardisation of street
design in new subdivisions and industrial estates, determined by varying
versions of the Engineering Standards, can be seen throughout the city.
With
expansion into the hillsides as flat land is becoming scarce; the impact of the
standards on development costs and the environment has led to a demand for less
onerous standards which reduce the impact on the environment. At the same time
the costs of Council’s own roading improvements, fundamentally based on
providing footpaths in the older subdivisions where they were not built at the
time of the original development, has increased dramatically as the flatter
streets are completed and the costlier hillside streets are prioritised.
Indications also showed that the public were particularly concerned about
vehicle speeds in residential streets. Questions started to be asked about the
necessity for footpaths in every street (however narrow or hilly) as being the
key driver for a large proportion of transport expenditure.
The
Land Development Manual 2010 addressed many of these issues and was welcomed by
the local construction industry and key stakeholders. It provided a more
holistic approach to the transport network and set down the fundamental
importance of sustainable road design, road hierarchy and accessibility. This
change was reflected by Council planners by prioritising the following plan
changes:
· Plan Change 21 – Parking and related changes;
· Plan Change 18 – Nelson South;
· Plan Change 17 – Enner Glynn and Brook Valley
structure plan;
· Plan Change 14 – Residential subdivision, Land Development Manual and Comprehensive
housing;
· Plan Change 13 – Marsden Valley.
The
new direction signalled by the Land Development Manual and the Plan changes is
now incorporated into all Council’s transport actions.
So
historically, street upgrades that have been driven by a footpath
prioritisation programme have been using most of Council’s capital
expenditure programme, including renewals and reseals funding which could have
been spent on maintaining the existing transport infrastructure.
The
2009 and 2012 Asset Management Plans recognised that there was an increasing
level of deferred maintenance resulting from this funding strategy and diverted
the renewals and reseals funding to maintaining the existing transport
infrastructure.
The
2013 Residents survey shows that the Transport activity remains the one Council
activity the public are most dissatisfied with. Figure 3.2 shows that Transport
is the one activity that ratepayers would like to see Council putting more
effort into based on the 2013 resident survey. This data was not collected in
the 2014 survey.
Figure 3.1 2013
Residents Survey – Activities Which Residents Would Like Council To Put
More Effort Into
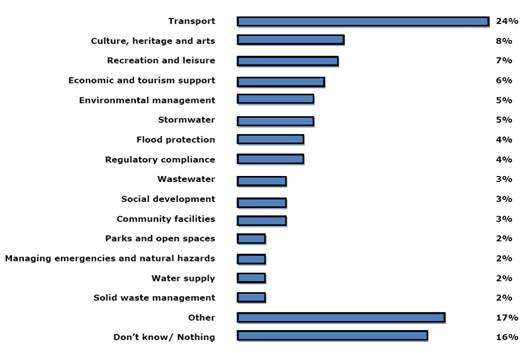
In
Council’s 2011 Annual Plan further changes were made with the deferment
of several hillside street upgrades and an increase in street lighting and
minor improvements funding.
In
2011 Council recognised that the Community has a high demand for Passenger
Transport improvements and initiated increasing service frequency by increasing
parking charges to fund improvements.
3.4. What Are
The Options?
Transport
choices made today will determine the competitiveness, quality of life and
resilience of Nelson for decades to come.
If
we do nothing but maintain the existing network, public dissatisfaction with
transport can be expected to increase.
The
Draft Government Policy Statement
clearly expects regions to focus investment on projects and services that offer
increased economic growth and productivity, while also providing value for
money through good asset management to improve the performance of the local
networks and road safety. It is important to recognise the following impacts
which the Draft Government Policy
Statement expects and which relate more to the local transport networks:
· A secure and resilient transport network;
· More transport choices, particularly for those with
limited access to a car;
· Improvements in the provision of infrastructure and
services that enhance transport efficiency and lower the cost of transportation
through better use of existing transport networks;
· Reductions in adverse environmental effects from land
transport;
· Reductions in road deaths and serious
injuries as a result of road crashes.
The advantage
of following the Draft Government
Policy Statement path is the opportunity to build future resilience into the
network and at the same time contribute towards the direction identified in the
Council’s 2060 (Sustainability) Strategy. Optimisation of our existing
network combined with a lesser reliance on private vehicles and a greater
encouragement of other modes can lead to:
· lower energy costs;
· increased quality of life;
· greater value for money;
· fast, safe, affordable transportation;
· vibrant streets and green areas;
· clean and healthy environment;
· cities for people.
3.5. A
Balanced Approach
The
2012 Transport Asset Management Plan adopted a “balanced approach”
towards transport in Nelson and that approach has been continued through to
this Plan.
Nationally
and internationally, current transport planning has supported the encouragement
of sustainable and alternative forms of transport for many years now, and
Nelson has been at the forefront of actively supporting these forms of
transport for over 15 years. Nelson has adopted a strategic momentum towards
providing greater quality transport choices through the Asset Management Plans,
the Regional Land Transport Strategy, Plan Changes and Council’s
strategic sustainability policies. This has been effective in improving the
walking and cycling networks in Nelson, and has supported the development of
improved reliable public transport that offer viable options to residents.
Nelson has developed a distinct travel choice culture.
This
approach is fundamental to this TAMP and to the continued integrated delivery
of projects by NCC over coming years. This will result in lower cost local road
upgrades which are fit for purpose, provide opportunities for travel choices
optimised whenever any project permits, and the travel needs of all road users
recognised and catered for as feasible. In doing so Council:
· Recognises the importance of well located, strong
transport corridors that offer the potential for the efficient and safe flow of
people and freight to assist the economic vitality of our region; and
· Acknowledges that more integrated
approaches to traffic flow (the importance of slower speeds and placing a
greater emphasis on walking, cycling and a sense of place) are necessary on our
local roads and residential streets to promote social and community networks,
supportive neighbourhoods, urban centres and safe streets.
4. The
delivery of a balanced approach
This
Asset Management Plan sets out how this balanced approach, initially
implemented in the 2012 AMP, is to be delivered in a cost effective manner. It
aligns Council’s expenditure to its strategic planning direction while at
the same time positions itself to qualify for national funding by aligning with
Government direction wherever possible.
The
following six focus areas are proposed:
· Local roads including walking, cycling and schools;
· Arterial traffic, including freight;
· Safety;
· Public transport;
· Parking;
· Value for money principles.
Appendix
E identifies how these focus areas link to Councils strategic plans and the
Government’s desired impacts.
This
section identifies levels of service, performance indicators, three year
performance targets, the current performance level and preliminary details of
the projects, activities and plans proposed to deliver the performance targets.
Funding
has been allocated to these focus areas at a higher level than the total
transport expenditure in recent years in recognition of the improvement that is
necessary in the transport activity to bring its public satisfaction rating
into line with Councils other assets and activities.
4.1. Defining
the Targets and the Delivery
This
section identifies the levels of service, performance indicators, three year
performance targets, the current performance level and preliminary details of
the projects, activities and plans proposed to deliver the performance targets.
Performance
targets identified below are for three years because the Asset Management Plan
is reviewed every three years. Council has ten year targets in the Regional
Land Transport Plan which are reported on annually to the Regional Transport
Committee.
The
performance targets don’t always directly relate to the implementation
package as in most cases it is difficult to measure the impacts of the packages
over the short term and targets have to be SMART[1].
Section
261B of the Local Government Act 2002 (Amendment Act 2010) specifies that the
Secretary for Local Government must make rules specifying performance measures
in relation to the provision of roads and footpaths. This rule was published in
February 2014 and is now operative.
4.2. Local
Roads, Walking, Cycling and Schools
These
services provide the essential services that contribute to the community
outcome of People-friendly places – “We build healthy,
accessible and attractive places and live in a sustainable region”.
The service levels are fundamental in delivering softer approaches to traffic
management (the importance of slower speeds and placing a greater emphasis on
walking, cycling and a sense of place) to promote social and community
networks, supportive neighbourhoods and safe streets.
A
service level statement for the road network identifying the basic transport
needs follows:
· Roads are safe to use and provide a comfortable and
reliable means of travel.
· The footpath and cycle network is considered to be
suitable, accessible, safe and well maintained.
· Road markings are maintained to provide clear
delineation and direction for roads, parking, and cycle lanes at all times.
· Bridges and related structures are designed and
maintained to provide safe access across the network.
· Traffic signals are designed and maintained to improve
traffic flow in the roading network.
· Appropriate signage is maintained to enable safe and
efficient way finding across the transport network.
· Adequate street lighting is maintained to enable safe
neighbourhoods and easy night driving on all urban streets.
· Stormwater is removed efficiently from road surfaces.
4.2.1. Walking and Cycling
The
guiding level of service relating to walking and cycling is:
Table 4.1 Level
of Service Relating to Walking and Cycling
|
Level of Service
|
Performance Indicator
|
Performance Target
|
|
Walking
and cycling are easy and attractive alternative transport choices.
|
Percentage
of the community that travel to work by walking or cycling (based on Nelson
City Council Annual Residents Survey and/or national census).
|
25%
of all journeys to work trips are by walking or cycling by 2018.
|
Table 4.2 Level
of Service Relating to Maintenance of Footpaths
|
Level
of Service
|
Performance
Indicator
|
Current
Performance
|
Performance
Target
|
|
MAINTENANCE
|
|
The
Network, and its services in good condition and are “fit for
purpose”
|
The
percentage of footpaths that meet or exceed the maximum acceptable roughness*
|
95%
|
95%
of the footpath network by length has a condition rating of ≤ 3
|
The
measure Council uses to monitor walking and cycling is the journey to work data
as it is a Census question as well as a question in Council’s annual
residents’ survey. Figure 4.1 below shows the journey to work data from
1996 to 2013 from the census and Figure 4.2 shows similar data from the annual
residents’ survey.
Figure 4.1 Journey to Work Data
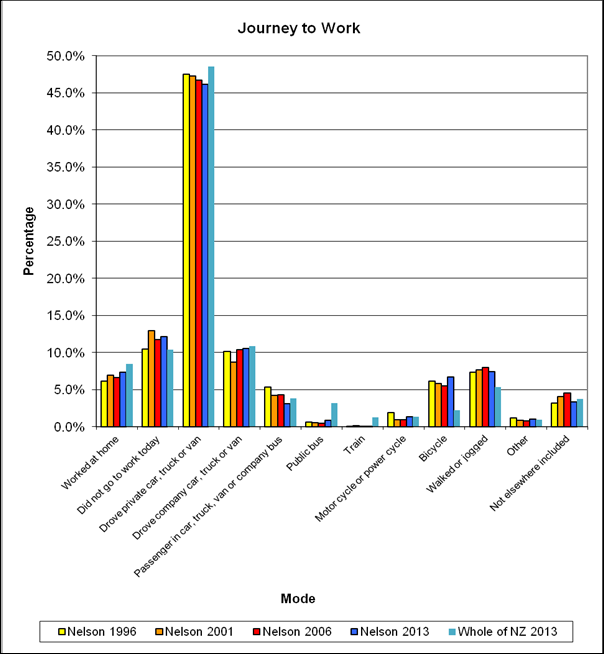
The
graph above shows that over half of the population travel to work by car, truck
or van, although a higher proportion walk or cycle in Nelson than the rest of
the country, averaging around 17% of all journeys to work.
Figure 4.2 Main Means of Travel to Work
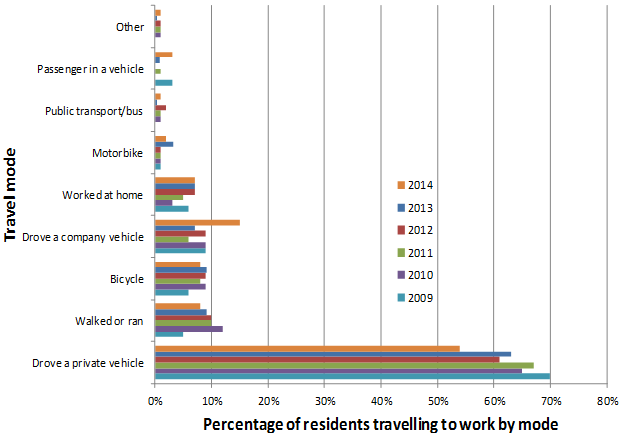
In
the 2014 residents’ survey 16% of journey to work trips were by walking
and cycling. This was slightly less than previous years although it is worth
noting that the absolute numbers of residents travelling by these modes
increased.
The
condition of the footpaths is of particular interest to the community,
especially relating to the surface condition and how this relates to safe use
by the increasing number of elderly and disabled residents. Council has
developed a new condition rating for use locally. Table 4.3 shows the
descriptions of each rating as well as the percentage, by length, of the
footpath network that meets the criteria.
Table 4.3 Footpath
Rating Descriptions and Summary
|
Rating
|
Description
|
Percentage length with rating (2014)
|
|
1
|
As new, no
significant cracking, even surface.
|
15%
|
|
2
|
Good
condition, safe to use, some minor cracking and/or scabbing/ravelling.
|
48%
|
|
3
|
Average
condition, could be some cracking, scabbing/ravelling and/or untidy but safe
to use, no significant hazards.
|
32%
|
|
4
|
Poor
condition, will need maintenance in near future, cracking more significant, may
be some settlement or sections may be lifting, surface may be uneven, small
bumps or ruts forming, broken edges, lichen, service covers may be raised or
low.
|
4%
|
|
5
|
Very poor
condition, needs to be fixed now, not safe to use, significant tripping hazards,
holes, humps and bumps, ruts and/or very uneven surface, service covers
and/or tree roots hazardous.
|
1%
|
Table
4.3 shows that around 48% of the footpath network is in good condition with a
further 32% in average but still safe condition.
4.2.2. The
Walk/Cycle/Schools Package
A
Walk/Cycle/Schools Package of Capital Works was adopted by Council through the
Regional Land Transport Programme in 2012-15 focussing on walking, cycling and
infrastructure around schools. The objectives are:
· To increase peak hour walking and cycling throughout
the City (acknowledging that journey to school mode is critical to reducing
congestion and achieving the other Regional Land Transport Strategy 2009
objectives).
· Increasing walking and cycling at all other times.
This package is more
than just the resolution of an issue. It is a strategic direction for a
community with limited funds that has identified its direction through many
strategic and policy documents (identified above). It aligns with many outcomes
of the Government Policy Statement and allocates a share of the available
regional funds to some local roading projects. A key driver for the support for
this Package is the outcome of the Arterial Traffic Study which did not support
the immediate progression of the southern arterial.
A
range of projects and measures across all activities were selected to extract
maximum value from previous investment, to complete significant network
connections and to encourage a further step forward in opportunities to walk
and cycle within Nelson. The package when completed will result in a well
integrated network with overall greater network safety.
There
were two State Highway network infrastructure projects critical to making
walking and cycling an easy choice for Nelson. These are aimed at providing
increased walking and cycling opportunities on or alongside state highways and
providing connection to the local network facilities.
The
proposed local infrastructure projects went towards completing separated cycle
facilities across the city (including linkages to Richmond), allowing the full
benefit of previous investment to be realised. New off road facilities from the
Central Business District to the Port along the banks of the Maitai River will
provide excellent connections for pedestrians, children, and less confident
cyclists. On-road facilities will fill the missing links in the key routes from
Tahunanui to Stoke. These key projects will be supported by a number of smaller
projects which will provide linkages within parks and reserves, better lighting
of roads and cycleways, and improved cycle parking.
The
following projects are programmed for the 2015-2018 period covered by this
Asset Management Plan under the walk/cycle/schools package:
· Rocks Road shared path;
· Tahunanui to Stoke cycle link;
· Maitai path bridge across Saltwater Creek.
·
· The Maitai to Rocks Road link was
added to the Walk Cycle Schools package in order to meet the funding criteria
for the Urban Cycleways Fund.
Targets for the
package are:
· Extend and further develop existing key walking and
cycling networks.
· Target schools to make walking and cycling for schools
children easier and safer, thereby reducing peak hour vehicle congestion.
· Reductions in deaths and serious injuries as a result
of road crashes.
· More transport choices, particularly for those with
limited access to a car.
· Reductions in adverse environmental effects from land
transport.
· Contributions to positive health outcomes.
4.2.3. Local Road
Maintenance and Renewals
The
guiding level of service relating to local road maintenance and renewals is:
Table 4.4 Level
of Service Relating to Local Road Maintenance and Renewals
|
Level
of Service
|
Performance
Indicator
|
Current
Performance
|
Performance
Target
|
|
MAINTENANCE
|
|
The
Network, and its services in good condition and are “fit for
purpose”
|
Smooth
Travel Exposure*
|
87%
|
87%
based on NZ Transport Agency standard roughness limits in ONRC
|
|
The
Network, and its services in good condition and are “fit for
purpose”
|
Average
road roughness standard (National Association of Australian State Roading
Authorities) by road classification.
|
Local,
106
Rural
Sealed, 97
|
The
following maximum average road roughness are not exceeded:
Local,120
Rural
sealed, 120
|
|
The
Network, and its services in good condition and are “fit for
purpose”
|
The
percentage of the local road (non State Highway) that is resurfaced*
|
4.8%
|
7.4%
|
Every
formed Council owned road is recorded in the Road Asset Maintenance Management
database. This database records pavement and surfacing, streetlights,
footpaths, construction and maintenance history, inspection data and traffic
volumes.
NZ
Transport Agency uses the National Association of Australian State Roading
Authorities[2]
reading to determine the average road roughness. Nelson City Council has
used National Association of Australian State Roading Authorities ratings to
determine if additional funding is necessary to maintain the roads to an
adequate roughness level. Figure 4.5 below shows the current average road
roughness standard (National Association of Australian State Roading
Authorities) by road classification. This shows a long-term decline
(improvement) in roughness linearly, but an increase (worsening) in roughness
during the last year for principal, sub collector and local roads.
Figure 4.3 Average
Road Roughness Standards (National Association of Australian State Roading
Authorities) by Road Classification
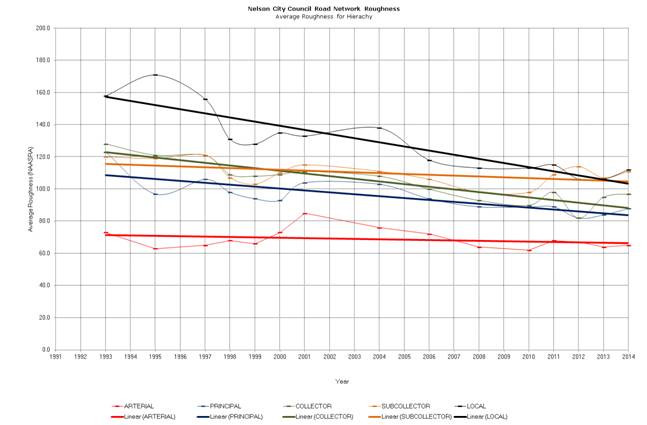
Smooth
Travel Exposure (STE) provides a measure of the proportion of vehicle travel
that occurs on roads that meet the roughness limits. Due to the complications
in assessing the financial implications of committing to a higher target than
already being achieved further analysis will be undertaken once the ONRC is
operative. The current level of STE is expected to be maintained for the next
three years due to the resurfacing of a large section of Waimea Road and has
been used as the performance target in this AMP. A new limit will be set for
the next Transport Asset Management Plan once the new ONRC results can be interrogated.
The
upper limit of the performance target of 7.4% of the network to be resurfaced
annually has been set based on the area estimated as able to be resurfaced with
the budgets detailed above. The lower limit of 5.4% of the target allows for
some level of uncertainty associated with the cost fluctuations in raw
materials increases in contract labour costs and poor ground conditions. The
range also allows for the programme to be changed should opportunities for
further optimisation be identified.
4.2.4. Road Surfaces
Up
until the last six years, NZTA supported the use of theoretical seal lives that
had been previously published by their predecessor, Transit NZ in 2005. Since
then, Councils have been required to extend the life of all of the pavement surfaces
that they maintain until all of their practical life has been utilised. In
order to provide some assessment of the likely future costs associated with
maintaining Nelsons roads, a revised seal life table has been developed that
more accurately reflects the practical life of the sealed surfaces in Nelson.
These seal lives have been based on the following factors:
· The current age of the existing surfaces
· The age of the surfaces programmed for reseal after
visual inspection
· The experience of Council’s road maintenance
staff
The
practical seal lives are shown in Table 4.5 with each entry colour coded
according to the confidence that Council officers have for each particular
entry. Green represents areas of very high confidence, orange represents moderate
to high confidence and red represents low confidence.
Table 4.5 Practical
seal lives in Nelson
While
the table above seems to illustrate a high level of uncertainty overall, the
areas shown in red do not represent a very high proportion of the sealed area
in the Nelson road network. The proportion of each surface type and
corresponding traffic volume range is shown in Table 4.6.
Table 4.6 Proportion
of Road Surface in Nelson by Type and Traffic Volume
Table
4.6 shows that almost all of the road network (approximately 93%), by area, is
of a type that there is high confidence in the practical surface life. The
revised surface life table is therefore considered to be fit for purpose in
assessing the likely forward renewal cost of the sealed surface.
It
is noted that the practical surface life table above details lives for each
surface type in a location that is appropriate. For example, AC16 will almost
always last a lot longer if used in the same location as AC10. In practice
though, AC16 is never used in the same location and is instead reserved for use
in much higher stress situations.
Currently
there is a change in seal technology towards more environmentally sound and
safer to use products. Further effect on the seal lives are driven by the changes
in the New Zealand vehicles fleet to front wheel power steering cars in
particular. These newer vehicles put the road surface under additional stress.
With
these changes comes uncertainly around the life of the surfaces. As a result
the surface life table will need to remain a live document that is revised
regularly to reflect the latest information that Council has about its road
surfaces. The table will be updated at least every three years after the major
inspection and programming of critical surfaces for resurfacing that takes
place in order to inform both the next Transport AMP and RLTP.
The
practical seal life table allows an assessment of the whole network how much of
it is due for reseal in each year. To follow this, a likely cost can be calculated.
The following assumptions were made in undertaking this assessment.
· All asphalted surfaces will be replaced with asphalt
at an average cost of $30/m2
· All non-asphalt surfaces will be replaced with a two
coat grade 3/5 chipseal or similar at an average cost of $6.80/m2
· Council staff time programming and managing the
reseals is 4% of the total cost
· Lifting services and remarking is 5% of the total cost
Figure
4.4 shows the projected resealing maintenance (or backlog) liability, proposed
spend and remaining liability after spend for each of the ten years beginning
in the 2015/16 financial year.
Figure 4.4 Expected
Future Resurfacing Costs/Liability
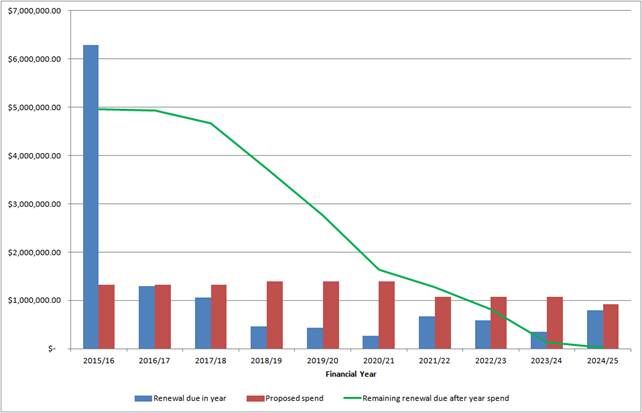
In
summary Figure 4.4 shows the following:
· There is a very large backlog of surfaces that have
exceeded their practical lives and need to be replaced urgently. This is
supported by Council staff observations that have shown that they have been
unable to reseal all of the critical surfaces in the 2014/15 financial year and
as a result will need to undertake more repair work.
· If Council was to catch up and keep up with the
reseals that are needed, when they are needed then around $6.3M would need to
be spent in the 2015/16 financial year followed by $1.3M and $1.1M for the two
years following.
· It is proposed to spread the backlog over the next 8
years as shown by the red bars. This results in a spend of $1.33M each year for
the 2015/16, 16/17 and 17/18 financial years followed by $1.4M each year for
the following three years. The spend then drops to around $1.1M from 2021/22.
The spend in each year includes a proportion of the backlog plus the area due
for replacement in that particular year with the backlog likely to be
prioritised first.
· Even though the backlog has been spread over eight years
the discharging of the overall maintenance liability associated with the
reseals essentially takes a full 10 years from 2015/16.
Of
note is the fact that the presence of this backlog will result in a future
‘hump’ that will occur approximately every 15-16 years requiring an
annual investment of around $2.8M at peak. This does not show in the ten year
period covered by this Transport AMP but first begins to appear again in around
2030/31.
Figure
4.5 shows the Surface Condition Index, which is a measure of various survey
faults (cracking, flushing, potholes, rutting, scabbing, shoving, patches) and
surface age. (The lower the surface condition index the better the pavement
is). The figure shows an improvement in the Surface Condition Index since 2008
after a significant increase (worsening) between 2004 and 2008.
Figure 4.5 Road
Network Surface Condition
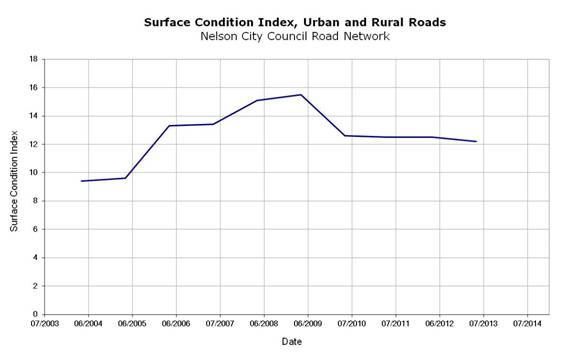
The
results in Figure 4.7 above show that we are effectively managing the aged
surfaces by targeting those in worst condition. More high volume roads in the
network have been asphalted which has further contributed to the improvement in
the Surface Condition Index. This data is a snap-shot in time only and does not
provide any assessment of future maintenance needs in time to allow effective
response to any issues.
4.2.5. Pavement Renewals
For
pavement renewals Council utilises field measurements, maintenance history and
engineering judgement to programme works. The quality of renewals undertaken
may be affected by the requirement to justify planned works with NZ Transport
Agency prior to funding approval. Works which cannot be justified from a whole
of life maintenance analysis will not receive a subsidy and as a result may be
deferred. Funding applications are yet to be completed for the renewals work identified
in section 5.3.3 so at this stage the extent of deferred renewals, if any, is
unknown.
4.2.6. Implementation
Package for Local Roads, Walking and Cycling and Schools
4.2.7. Walking, Cycling
and Schools
There
is a clear correlation in Nelson between arterial congestion in the peak hours
and school term times. Around 56% of New Zealand children are driven to school
each day, increasing from 45% in 1998.
Driving
to school instead of walking reduces children’s physical activity and
increases traffic congestion and air pollution. Nearly every part of the city
is within 500m from a school, which is considered an acceptable walking
distance for most children. Clearly improving the walking and cycling facilities
around schools has the potential to change the way students travel to school
and alleviate peak hour congestion at the same time.
Some
of the projects, activities and plans proposed that relate to schools are:
· Encourage Walking School Buses, Feet First & Walk
to School promotions, Bike Wise, and other events and activities designed to
promote and encourage using active transport as a mode of travel to and from
school, with liaison with the schools.
· Improvement of School Entrances and frontages to encourage
active modes.
· Increased parking enforcement around schools.
· Delivery of cycle skills education courses in both
schools (and the wider community) as part of the regional RIDE ON cycle
strategy. This strategy includes working alongside recreational providers to
run activities that encourages cycling in general and in particular safe
cycling practice.
· Ongoing encouragement of active modes delivered
through council publications and media such as Live Nelson.
4.2.8. Local Roads
Local
roading investment requires expanding if overall service levels are to be
maintained. In 2012 the reseal budget was increased although the roading
maintenance budgets were frozen and have not kept pace with the expansion of
the network though subdivision development, or inflation. This has led to
deterioration in the performance of the network.
Additional
local roading maintenance and renewal projects proposed to maintain the
existing level of service are:
· Increase sealed pavement maintenance budgets from
$469,000 to $500,000.
· Resurfacing budget from $1.33 million/year for the
first three years before increasing to $1.4 million for years 4-6 and then
reducing to $1.1million/year for year 6-9 to ensure the sealed surfaces keep
the high value base course layers dry.
· Increase structural replacement programme for bridges
and retaining walls via the structures component replacement budget of
approximately $330,000 pa.
· Increase for streetlight renewals costing
approximately $270,000/year to allow the replacement of poor performing lights
with LED luminaries.
· Provide a pavement renewal budget in the order of $350
pa.
·
· The LTP has amended
the following:
· For years 6-9, the
reseal budget remains at $1.4 million.
· Structures
component replacement budget reduced to $295,000 in year 1 but increased to
$500,000 in year 2.
· It is noted that
the level of funding to be received from NZTA is less than originally budgeted
for maintenance and renewals. There is potential for additional funding to
become available from the NZ Transport Agency in years 2 and 3. In response,
Council has retained the renewals budget in years 2 and 3. This will ensure
that the local share will be available should NZTA provide further funding. If
not, the renewals budget will be varied in these years at the annual plan
stage.
Other
local roading capital projects proposed to improve the Levels of Service are:
· Continue to implement street lighting upgrade
programme to enable safe and easy night time driving, and expansion of lighting
to shared walk/cycleways such as the Railway reserve.
· Safety upgrades at the intersection of Toi Toi Street
and St Vincent Street.
· Upgrade only those roads where traffic volumes, safety
issues or utilities upgrades justify a full upgrade.
· Increase in the Minor Improvement Programme to
$650,000 pa.
· Finish implementation of the walking/cycling and
schools package identified in the Regional Land Transport Programme 2012-15.
Note that it is not intended to update the Council’s Pedestrian Strategy
(2005) or Cycling Strategy (2006). Nelson is far enough advanced in its walking
and cycling implementation that it would not add any benefit to its Walk /
Cycle funding package, rather walking and cycling is included in this AMP and
in the RLTP.
· Continue to enhance the Central Business District
through works identified in Heart of Nelson and other new priorities. $100,000
has been allowed for in year 1 and $500,000/year for years 2-10.
· Provide a footpath improvement budget of $50,000 for
the first year for design and the $200,000/year for years 2-10 to provide
missing footpath links.
The budgets for CBD enhancement were changed to $50,000 in
year 1, $250,000 in years 2 and 3 and $300,000 in year 4. No budget has been
allocated for years 5-10.
POLICY
NOTE: - With the installation of the ultra fast broadband cabling in many
streets and footpaths there is an opportunity to provide a small proportion of
funding to resurface the total width of the footpaths when the trenches are
being reinstated. This is excellent value for money although the opportunity to
upgrade these footpaths to the 2010 Land Development Manual standards is
limited. It is proposed that the footpath renewals budget be utilised to
facilitate this and similar future opportunities.
Other
local roading capital projects proposed to cater for growth are:
· Rural Road seal extensions - It is proposed to use
recycled asphalt millings to seal rural roads. These will not be reconstructed
to full Land Development Manual standard but surfaced to minimise the ongoing
maintenance required, reduce dust issues and improve safety.
· Todd Bush Road.
· Marsden / Ridgeway intersection.
Council
has an ownership responsibility to manage the road reserve in a cost effective,
sustainable, well planned and coordinated manner to agreed levels of service.
Council has a number of individual policy and procedures, many of which require
updating. It is proposed that an overarching Road Management Policy is
developed to include:
· Road Reserve Management Policy and Procedures;
· Road Reserve Operations and Maintenance Policy;
· Road Occupation Policy (Structures on Road Reserve);
· Parking Policy;
· Road Stopping, Sale and Acquisitions Policy;
· Speed complaints procedure;
· Signage Policy;
· Power and Telecom Undergrounding Policy;
· Roading Improvement Policy.
4.3. Arterial
Traffic
These
service levels provide the other half of a balanced network approach by
recognising the importance of well located, strong transport corridors that
offer the potential for the efficient and safe flow of people and goods to
assist the economic vitality of our region. The service levels contribute to
the government outcomes providing “an efficient transport system that
supports high levels of economic productivity, provides strong international connections
for freight, business and tourism, and meets international obligations”
and the community outcome of people friendly places - “We build healthy,
accessible and attractive places and live in a sustainable region”.
Council’s
main arterial corridor is from the Queen Elizabeth II / Haven Road roundabout,
along Haven Road, Halifax Street, Rutherford Street, Waimea Road and Main Road
Stoke and the link from the State Highway / Annesbrook roundabout to Main Road
Stoke along Annesbrook Drive. The other corridor routes, between Annesbrook
roundabout and the Beatson Road roundabout, and along the state highways are
owned and managed by NZ Transport Agency.
Delays
in arterial traffic travel times and a widening of the peak travel periods are
an indication of inefficient use of transport routes and have a negative impact
on economic productivity. By monitoring travel times and peak spread on key
routes we can see whether these routes are efficient. Appendix H shows
graphically the peak spread and delays on the Rocks Road and Waimea Road
corridors.
The
current average delays have been measured to be 3 minute on Rocks Road and 2
minutes on Waimea Road. It is noted that the dataset for this measurement is
very small due to the complexities associated with collecting the data. Nelson
City Council has partnering with NZTA and installed a wireless detection system
to measure travel times. This improvement in technology will allow a much
larger sample to be collected and improve the effectiveness of this measure.
Table 4.7 Level
of Service Relating to Efficient Transport System
|
Level of Service
|
Performance Indicator
|
Performance Target
|
|
An
efficient transport system that enables people and freight to move
efficiently.
|
Average
AM and PM peak hour travel times on Waimea Road and the State Highway between
Annesbrook and Haven Road roundabout.
|
Average
peak hour travel time delays are no greater than 5 minutes above uncongested
travel times.
|
The
Nelson to Brightwater Corridor Study model provides levels of service for the
transport corridors. Generally a level of service of C or above is considered
appropriate for local arterial transport roads. The definition of the level of
service along with classification of the key corridors is provided in Appendix
F.
The
2009 modelling predicts that current levels of service are below C around the
three roundabouts which connect the State Highway 6 to Main Road Stoke and
Salisbury Road, close to the Nelson/Tasman boundary and along parts of Waimea
Road. Observations of these intersections confirm that they continue to operate
at a level of service worse than C and are likely to continue to in the
foreseeable future.
The
5 minute delay defined as the performance target represents an average delay of
around 1 minute per kilometre over the measured distance. Based on the
Austroads Guide to Traffic Management Part 3: Traffic Studies and Analysis,
Sections 5.2.2 and 5.2.3, this level of delay is expected to result in a level
of service of C for the route as a whole. The descriptions of the level of
service flow characteristics contained in the Austroads guide are similar to
those contained in Appendix F.
Nelson
City Council has used National Association of Australian State Roading Authorities
ratings to determine if additional funding is necessary to maintain the roads
to an adequate roughness level. Figure 4.3 shows the current average road
roughness standard (National Association of Australian State Roading
Authorities) by road classification, along with proposed target levels.
Table 4.8 Level
of Service relating to Road Network and Its Services
|
Level of Service
|
Performance Indicator
|
Performance Target
|
|
The
network, and its services in good condition and are "fit for
purpose".
|
Average
road roughness standard (National Association of Australian State Roading
Authorities) by road classification.
|
The
following maximum average road roughness are not exceeded:
Arterial/Principal,
100
Collector/Sub
C, 110.
|
4.3.1. Implementation
Package for Arterial Traffic
Many
of the local roading maintenance and renewal initiatives identified in 4.2
above also include, and prioritise the arterial roads. These budgets are not
split between local and arterial roads and it is not considered necessary to do
so, but the budgets allocated include all local roads and arterial roads.
The
2012 AMP included an action to update the transportation modelling, undertaken
as part of the Arterial Traffic Study, once the 2013 census data became
available. Closer examination of the traffic data on the main arterial routes
has shown that, while all of the growth in population and households assumed in
the model has been realised, the arterial traffic volumes have been reducing to
a level well below those predicted in the model. As a result an update of the
model will not change any of the Arterial Traffic Study recommendations other
than to push the need for any works further into the future than previously
recommended. It is proposed instead to monitor traffic volumes closely and look
to update the model after the next census unless it is carried out sooner by
the NZTA for the purposes of investigating the Southern Arterial.
Council
has investigated some of the transport issues that relate to the poor peak hour
travel time performance of the arterials, such as the arterial traffic study,
the NZ Transport Agency / Nelson City Council / Tasman District Council three
roundabouts study and the Waimea Road intersections.
Capital
projects to improve the level of service and provide for future arterial
traffic growth include:
· Annesbrook Drive crossing facilities;
· Update and review the transport model following the
2018 Census (in partnership with NZ Transport Agency and Tasman District
Council as the model ownership is equally shared);
· Provide off-street car parking in Tahunanui near the
Bisley Avenue intersection to allow reinstatement of the two southbound through
lanes;
· Complete the cycle link on SH6 between the Crop and
Food building and the recently completed Maitai walkway;
· Rocks Road walking and cycling facilities;
· Projects identified in the Regional Land Transport
Plan;
· Increase frequency of NBus on the arterial routes.
A
number of intersection improvements proposed by the Arterial Traffic Study have
been found to delay through traffic on the arterial roads to a level that any
major improvements to the intersections cannot be progressed on economic
grounds. Instead it is proposed to undertake more modest work in order to
improve safety in particular.
4.4. Safety
This
service level is an essential part of managing the transport network and has
been chosen to align with “Safer Journeys” which is the
government’s strategy to guide improvements in road safety over the
period 2010 to 2020. The strategy’s vision is “a safe road system
increasingly free of death and serious injury”.
The
safe system approach to road safety recognises that drivers make mistakes but
should not die or be seriously injured as a result. As a local road controlling
authority, Nelson City Council has a part to play in providing safe roads and
roadsides along with safe speeds on the roads that it administers.
The
road safety service level statement is:
“To
work towards a safe road system increasingly free of death and serious
injury”.
The
Local Government Act 2002 requires all road controlling authorities to have a
level of service relating to the number of fatalities and serious injuries and
report on these annually.
Table 4.9 Level
of Service Relating to Road Safety
|
Level of Service
|
Performance Indicator
|
Performance Target
|
|
Road
safety.
|
Number
of deaths and serious injuries in road crashes
|
Reducing
at 4% per year from a base of 2007
|
Figure
4.6 below shows that since 2007 the number of fatalities and serious injuries
on Nelsons Roads has fluctuated at or above the target maximum.
Figure 4.6 Number
of Fatal and Serious Injuries on Local Roads in Nelson
Around
half of all urban crashes on the network are at intersections, and of these
intersection crashes, the worst intersections account for a significant
proportion of the overall social cost.
Table 4.10 Level of
Service Relating to Road Safety at Intersections
|
Level of Service
|
Performance Indicator
|
Performance Target
|
|
Road
safety.
|
Annual
social cost of crashes (injury and non-injury) at intersections.
|
The
social cost for each year reduces by at least 4% per year from a base of
2007.
|
Figure
4.7 below compares the social costs of all intersection crashes since 2007.
Figure 4.7 Total
Social Cost of Urban Intersection Crashes (Injury and Non-injury)
It
is important that the focus on road safety is driven by robust criteria for
selecting intersections for improvement works. As with anything associated with
road safety it is critical that specialist road safety engineers assess any intersections
identified to confirm the need for their inclusion in any forward work program.
In
general, crash rates at intersections between local (non state highway) roads
are lower than the thresholds that can justify standalone safety improvement
works. Instead, the intersections with higher crash rates in the Nelson context
will be treated via use of the minor improvements budget.
Nelson
cyclists initially appear to be over represented in casualty data compared to
other peer group locations. This measure of over representation has
traditionally been the number of cycle crashes as a proportion of total
crashes. This does not provide a reliable measure of performance when compared
to the rest of peer group B (Palmerston North, Napier and Invercargill) as the
number of people cycling on the network is not taken into account. Instead it
is important that Nelson City strives to provide continued improvement to its
cycle network to reduce the vulnerability of cyclists regardless of what other
regions in New Zealand are achieving.
With
the intention to continue to provide infrastructure and promote cycling in
Nelson City it is important that any development of cycling infrastructure be
done in a sustainable safe manner. As a result the indicator for cycle crashes
recognises the likelihood of increased cycle use.
Table 4.11 Level of
Service Relating to Road Safety and Cyclists
|
Level of Service
|
Performance Indicator
|
Three Year Performance Target
|
|
Road
safety.
|
Number
of crashes involving cyclists.
|
Nelson
City cycle crash numbers do not increase from those in the base year of 2007.
|
Figure
4.8 shows that the number of crashes in the last three years has gradually
increased to be above the target maximum of 23 crashes in any one year.
Figure 4.8 Number
of Cyclist Crashes in Nelson City
The
total social cost for cycle crashes measures the overall cost of the crashes in
terms of medical, economic, productivity and physical cost associated with
causalities in particular. In 2012 the total social cost of all cycle crashes
in Nelson was $8.8M, a high for the last complete five year period. This
reduced to around $5.7M in 2013. This measure provides some context in relating
the cost of safety improvements for cyclists and the potential savings.
Pedestrian
crashes in Nelson are typically clustered around the three main business
districts in Nelson, Tahunanui and Stoke as well as around each of the schools
in the area. In particular, any crash that involves a pedestrian has a much
higher chance of resulting in serious injury or death. This results in
relatively focused areas where safety related spending for pedestrians can be
concentrated. With this in mind a falling cap of pedestrian related crashes is
appropriate as follows.
Table 4.12 Level of
Service Relating to Road Safety and Pedestrians
|
Level of Service
|
Performance Indicator
|
Three Year Performance Target
|
|
Road
safety.
|
Number
of crashes involving pedestrians.
|
The
number of crashes involving pedestrians each year reduces by at least 4% per
year from a base of 2007.
|
Figure
4.9 shows that the number of crashes involving pedestrians has increased above
the number in 2007 and are not reducing in line with the target maximum. This
indicates that further effort and spending in this area of road safety is
needed.
Figure 4.9 Number
of crashes involving pedestrians in Nelson City
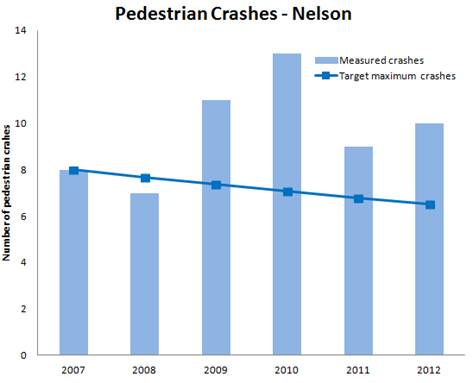
4.4.1. Implementation
Package for Safety
The
Safer Journeys: New Zealand’s Road Safety Strategy 2010-2020 published by
the Ministry of Transport proposes a Safe System approach which focuses on
creating safer roads, safe speeds, safe vehicles and safe road use. Clearly
local authorities are tasked with three of these four focus areas, and
delivering in these areas will also contribute to the levels of service
identified above.
The
Safe System approach is implemented in a coordinated way with other sectors of
the Nelson Community (Tasman District Council, New Zealand Police, Accident
Compensation Corporation, Nelson Marlborough District Health Board, NZ
Transport Agency) through the Nelson Tasman Road Safety Action Plan.
Some
of the projects, activities and plans proposed for safer roads are:
· Intersection improvements, targeting high risk
intersections.
· Capital works providing improved walking and cycling
facilities.
· Targeted minor improvements programme focussing on
schools, walking and central business district minor safety projects.
· Improved line marking and street lighting.
Some
of the projects, activities and plans proposed for safe speeds are:
· Targeted minor improvements programme focussing on
speed issues.
· Speed limit reviews that consider changes over local
roading areas i.e. around hospital and Waimea Road.
· Local road treatments to reduce the speed environment
such as through intersection changes, line marking upgrades, the installation
of flush medians, installation of street trees etc, where appropriate.
· Lobbying government to make changes to the Road User
Rules to allow greater speed enforcement to be used to reduce speeds rather
than rely on expensive road treatments.
· Implementation of the speed reduction methods in the
Land Development Manual and Shared space ideals when considering roading
capital improvement projects.
· Implementation of an urban speed reduction programme
delivering stopping distance demonstrations, including emphasis on speed around
schools, a “Wipe off 5” multimedia campaign (similar to that run in
Victoria, Australia), and a community development and neighbourhood ownership
programme calling for safer speeds and increased acceptance of traffic calming
on local roads.
· Install arterial pedestrian and cycle crossings.
Some
of the projects, activities and plans proposed for safe road use are:
· Campaigns that promote to motorists the “share
the road” message will be run along with ongoing support for data
collection through 0800CYCLECRASH.
· Youth Education and information initiatives to this
high risk sector will continue to be delivered.
· Continuation of the RYDA programme which co-ordinates
the efforts of local road safety experts, driving instructors, the Police,
recovering victims of road crashes, drug and alcohol educators and insurance
and financial services personnel in such a way that 1500 year 11 students are
made aware of the privilege, cost and responsibilities of owning and driving a
motor vehicle.
· Six motorcycle training courses using qualified
instructors with at least two of these courses aimed at the younger scooter
riders, publications on license requirements and a print based publication
aimed at riders and other motorists.
4.5. Public
Transport
In
early 2012 Council commenced an improved passenger transport service funded
from increased parking charges. Council’s strategic direction on
Passenger Transport is outlined in the Draft
Regional Public Transport Plan [under development
in 2014 in parallel with the Regional Land Transport Plan].
The
service level is targeted towards providing the user with transport choices and
as a means of reducing traffic congestion.
A
review of the new service was undertaken in 2013. This review report can be
found at A1119385. The review found that the service is operating well on the
arterial routes. However the collector routes are less successful.
In
2014 some early and late services on the collector routes were cancelled to
fund a weekend service on the Waimea Main Road Stoke Arterial Route.
Table 4.13 Level of
Service Relating to Public Transport Services
|
Level of Service
|
Performance Indicator
|
Performance Target
|
|
Public
transport services that meet the transport needs of the community with an
equitable sharing of costs.
|
The
farebox recovery ratio.
|
50%
|
Since
the introduction of the NBus public transport system the fare recovery ratio
has increase from around 60% in the 2012/13 year to 62% in 2013/14. Prior to
this period the bus system was privately run and the fare recovery ratio is
unknown.
4.5.1. Implementation
Package for Public Transport
· Update and implement the Regional Public Transport
Plan for 2015-18 including:
· Increase network coverage in Stoke
· Continue with public transport promotion to encourage
an increase in patronage.
· Continue with the bus shelter installations and
upgrades.
· Conduct user and non user surveys every 2 years and
use feedback to improve services.
· Construct additional infrastructure on hail and ride
routes to increase visibility of service.
· Continue to work with Tasman District Council with a
view to improve the network coverage in Richmond
· Implement real time bus tracking
4.6. Parking
Parking
revenue, sundry rents such as street dining and street stalls are used to fund
the Inner City Enhancement account. Inner city expenditure covers many
activities such as maintenance of the meters and brickwork, rental charges for
private land occupied by the public, rates, grants for inner city co-ordinator,
hanging baskets, Central Business District litter collection and depreciation,
operations and maintenance, renewals and enhancement works. Council also
recognised in the 2011 Annual Plan that increasing parking charges was a useful
travel demand management tool to encourage sustainability and to optimise the
networks resilience by using the additional income to subsidise the passenger
transport improvements. Recently however, Council has indicated that the
contribution to passenger transport will cease to come from the Inner City
Parking account at the end of the 2014/15 financial year and come from general
rates.
Currently,
any surplus or deficit in the Inner City Parking account, once the contribution to passenger transport is made
is transferred to or from the Parking Reserve and if there are not sufficient
funds, the shortfall is borrowed. The Parking Reserve also acts as the
balancing account for Parking Enforcement and the Millers Acre property
account.
As
most vehicular journeys involve parking at both the start and end of each trip,
the availability and cost of car parking can influence decisions on transport
mode used, the time of travel and, potentially, the choice of destination. The
provision of parking facilities also impacts on the urban environment and may
take up valuable space, thereby increasing property development costs.
A
balance must be struck between the provision of an adequate supply of parking
to meet the needs of a dynamic, competitive economy, optimising valuable city
centre land and encouraging the use of good alternatives to single occupancy
vehicles.
Essentially
short stay parking should be of sufficient capacity, carefully costed, well
located and accessible. Long stay parking should not compete with short stay
capacity, and should align with the wider transport policy.
The
Parking service level statement is:
“Parking
is easy to use, and is rationed fairly and equitably”.
There
are approximately 1,440 short stay parking spaces in the central core area; these
had a peak midweek and Saturday occupancy in December
2012 of around 90%. This equates to around 140 free spaces in the central
area at peak times. These peak times tend to be in the middle of the weekdays,
between 11am and 4pm and between 11am and 12.30pm on Saturdays.
Table 4.14 Level of
Service Relating to Short Stay Parking
|
Level of Service
|
Performance Indicator
|
Performance Target
|
|
The
supply and pricing of short stay parking managed to encourage commercial
activity in the city centre.
|
Percentage
of short stay parking spaces occupied in midweek peak in December.
|
85%
|
Table 4.15 Level of
Service Relating to Parking
|
Level
of Service
|
Performance
Indicator
|
Current
Performance
|
Performance
Target
|
|
PARKING
|
|
The
supply and pricing of long stay parking is managed to incentivise greater use
of travel options other than cars.
|
Occupancy
of long-stay parking spaces between peak travel times measured at 5 locations
within the CBD fringe.
|
Not
currently measured but will be in the future.
|
A
reducing trend.
|
Should
occupancy rates drop constantly below the performance target then Council
should consider relaxing the short stay time restrictions. Should occupancy
rates be constantly above the performance target then Council should consider
increasing parking fees or making more short stay spaces available within the
CBD.
The
distance recognised in the New Zealand Pedestrian Planning Guide as being the
optimum maximum distance commuters should be expected to walk from their car to
their work is 1.6 kilometres, which is a 20 minute walk at 5 kilometres/hour
for a fit healthy adult (ie 450m takes 5 minutes and 900m takes 10 minutes).
This distance puts much of the fringe area of the Central Business District
within parking distance of the core of the Central Business District.
Uncontrolled all day commuter parking currently occurs in many residential,
commercial and light industrial areas of the Central Business District fringe
area. It is important that as pressure on parking grows in the future this
uncontrolled parking should be rationalised to minimise its impact on the
viability and value of the fringe areas and more use of multiple occupant
vehicles and public transport encouraged.
An
acceptable walking distance is a relatively fluid concept. Some people happily
walk many kilometres, while even short walks are difficult for the elderly,
disabled or children. By far the majority of city centres are about 1km across.
This means a walk of a kilometre or less will bring pedestrians around most of
the functions of the city.
Table 4.16 Level of
Service Relating to Long Stay Parking
|
Level of Service
|
Performance Indicator
|
Performance Target
|
|
The
supply and pricing of long stay parking managed to incentivise greater use of
transport options other than cars.
|
Occupancy
of long-stay parking spaces between peak travel times measured at five
locations within the CBD fringe.
|
A
reducing trend.
|
A
parking study was undertaken in 2014 that informed the development of the draft
‘Parking Strategy 2014-2024’.
Survey
data collected in 2005, 2008 and 2012 shows there is an appropriate supply of
parking. Forecasting indicates there is unlikely to be any significant increase
in demand over the next ten years.
The
engagement undertaken has indicated that the Nelson public consider the key parking
issues to broadly be:
· Enforcement – Since September 2013 parking
enforcement has been undertaken by EIL. This has returned the level of
enforcement to those prior to 2011. There is a perception this level of
enforcement is too stringent and that enforcement should be more flexible.
· Cost and payment options – Users of the parking
in the CBD want payment options that provide more choice and flexibility.
· There is a desire for more all day parking within the
CBD together with an overall increase or redistribution of parking.
Subsequent
to the draft parking strategy being prepared, Council, in response to the
concerns of inner city retailers, resolved to remove the charge for parking for
a winter trial period. As a result, finalisation of the strategy has been
delayed until after this AMP has been completed. This AMP allows for the
implementation of the actions detailed in the draft parking strategy but
recognises that the direction and content of the parking strategy may change
and some actions may not be necessary or other options may be trialled to
ascertain their impact before the future direction is set.
Council resolved during the LTP deliberations to make the
first hour of parking free to users and then increase the hourly rate to $1.50
for any time after.
4.6.1. Implementation
Package for Parking
· Provide more payment choices at parking meters;
· Manage the current parking supply to ensure the most
sought-after parking spaces are available to be used by visitors to support the
economic viability of the central CBD and Stoke;
· Trial the allocation of car pool spaces in high
demand, high visibility locations in the city centre. Promote the trial with
existing and potential users;
· Work with a CBD focus group to implement schemes to
encourage visitors in the quiet winter months and focus on alternative
transport modes to the private motor vehicle;
· Improve the layout and access to Strawbridge Square
carpark;
· Secure a pedestrian corridor between Beach Road and
Tahunanui Drive to enable better use of the Beach Road carparks;
· Provide better information for drivers to find parking
areas such as improved signage from the CBD ring route to the parking squares.
4.7. Value for
Money Principles
Value
for money means a culture of continually seeking better and smarter services
and ways of operating the transport activity. This is a concept that is high on
the agenda in the Draft Government
Policy Statement on land transport funding which seeks to make better use of
the land transport network. Improved network management and selective
development is needed to lift the performance and capacity of the existing
network and minimise the need for major investment in new infrastructure.
The
following implementation package will ensure value for money:
· Road maintenance procedures will be used in a way that
will optimise the amount of benefit gained from the money spent.
· Investigation of collaboration and shared services
with Marlborough District Council and Tasman District Council.
· Improved asset management to ensure renewals are
optimised.
The
public will base much of the perception of value for money on how the Council
delivers road improvements. The Council operates a road improvement policy
which is aligned with value for money principles. This means improvements shall
provide a high level of public amenity within the road that reinforces the
importance and value of roads as public places. Upgraded roads would enhance
personal security, facilitate slow vehicle speeds in residential areas and accommodate
people that are less able or vulnerable, such as those with mobility and visual
disabilities. The minimum standards in the Land Development Manual 2010 will
reinforce the quality and therefore perceived value of the works.
Table 4.17 Level of
Service Relating to Public Satisfaction
|
Level of Service
|
Performance Indicator
|
Performance Target
|
|
Public
Satisfaction.
|
Percentage
of public satisfied and dissatisfied with the transport activity (based on
Nelson City Council Annual Residents Survey).
|
More
than 50% of respondents are either very satisfied or satisfied, and less than
10% are either dissatisfied or very dissatisfied.
|
Figure 4.10 Percentage of
Public Dissatisfied with the Transport Activity
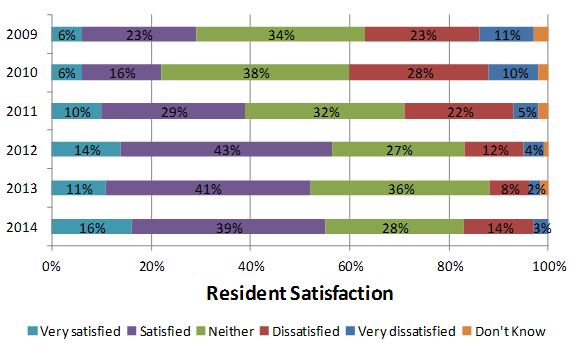
A
key driver for public satisfaction in terms of value for money is provision of
good communication to explain issues to public. Key issues that the Council
convey or intend to convey to the public include:
· Importance of the arterials.
· Parking policy and no-stopping lines.
· Issues around local road speeds.
· The success public transport improvements.
· Council’s strategic direction.
· Key safety issues for Nelson.
· Congestion explanations.
· Conflict on shared paths.
· Structures on road reserve.
· Resurfacing policy.
· Traffic calming measures and techniques.
· Explaining how council develops its minor improvements
and footpath and road upgrade programme.
Much
of this information is provided within the policies on the Council Website and
is included in Live Nelson when the topic is in focus. It is important for the
public to understand the rationale of the Council’s decisions and
processes. It is hoped that with increased public understanding the value of
Council transport activities and projects will be perceived to be positive.
Recent
projects and studies have used the consultation section of the Nelson City
Council website to communicate with residents. The Council’s transport
staff also participate in as many forums as practical to answer questions
raised by the public and providing explanations on transport issues. Talking
this approach supports the value for money principles by engaging with the
public and making sure the opinion of the public is heard.
It
is important that the community knows the Council is listening and addressing
their concerns, which the Council is committed to doing.
The
Council also responds to requests from the public in a timely manner which is
managed by the service request system which will help to elevate the
satisfaction levels of the public.
4.8. Systems to Measure, Monitor and Report on Performance
Indicators
4.8.1. Local Roads,
Walking, Cycling and Schools
Much
of the performance of the local roads is contained within the Council Road
Asset Maintenance Management database. The road roughness and rating is
gathered through surveys over the entire network every two years and reported
on in the Infrastructure Annual Reports. The latest computer software running
the Road Asset Maintenance Management database allows any Road Asset
Maintenance Management information to display spatially on maps so any areas
that may fall below the performance indicator levels can be identified.
The
footpath network undergoes an audit every three years for the quality and
safety of the network. This not only enables the performance to be measured but
also maintenance work to be programmed. The results of the audits can be found
in the Footway Audit Report.
The
rate of walking and cycling can be measured in two ways. Firstly the census
results which are freely available from Statistics New Zealand contain
information on the mode of travel people chose to get to work; including by
cycle or by foot. This information is gathered every five years. The second
method is through the Annual Residents Survey as it contains questions in
relation to the surveyed persons choice a travel mode. These results are
published in the Council Survey of Residents report.
The
regular cycle counts at key screen lines in the cycle network reveal the trends
in cycling and provide some insight into whether the targets for increased
cycle use are heading in the right direction.
4.8.2. Arterial Traffic
The
Council owns a TRACKS strategic transport model that was built in 2006 for the
Nelson to Brightwater Study and updated in 2009 for the Arterial Traffic Study
using 2006 census data. The validated model shows the Level of Service in terms
of congestion and intersection delay. The Council intended to update the model
in 2014 with the latest census data. However there was not enough change from
the 2009 update to justify the expense. The Level of Service for the Waimea
Road and SH6 Arterial routes can be checked and compared to the performance
indicators and reported in the model reports.
The
Waimea Road arterial route is of significant importance to the Council
because it is not a state highway and therefore the sole responsibility of the
Council. The Council assesses this route more frequently through monitoring
travel times every quarter and volumes monthly.
From
2015 travel time surveys will be undertaken using wireless detection methods.
This will provide a much larger sample than the current car following method.
4.8.3. Safety
The
statistics for accidents involving motorists, cyclists and pedestrians are a
good indicator on how safely the transport network is operating. These
statistics are gathered by the New Zealand Police and processed by the NZ
Transport Agency using their Crash Accident Database. The accidents within the
City of Nelson are extracted yearly so that the accident rates can be compared
with the peer group average from around New Zealand. This also enables the
progress of road safety to be monitored.
Additional
cycle crash data is collected via the 0800 Cycle Crash hotline. This hotline is
a joint initiative with TDC, NZ Transport Agency and ACC and designed to
capture all of the crashes and near misses involving cyclists that do not
typically make it into the NZ Transport Agency database.
The
data is reported with internal annual road safety reports.
4.8.4. Public Transport
Each
quarter the key metrics of patronage and fare revenue by route, by zone and by
ticket type are collated and reviewed to monitor the performance of the Public
Transport system. At the end of each financial year the Council undertakes a
financial analysis of the public transport service. This enables the revenue
from the farebox to be compared to the operating cost of the public transport
network.
These
values are reported in the annual plan and therefore the performance of the
public transport network can be monitored over time.
4.8.5. Parking
The
Council undertakes a midweek parking survey each year in December which
measures the occupancy of the short stay parking spaces within the central core
area. A survey of five sample areas in the fringe area is also surveyed in
order to measure commuter parking demands. The peak occupancy is recorded and
this can be compared to the performance target occupancy rate. The results are
reported within the annual plan.
Every
4-5 years more comprehensive data is collected for the CBD and the fringe areas
bordering the CBD. The surveys collect occupancy data for the whole area and
duration of stay data for sample areas around the CBD. These surveys are
undertaken on a Thursday and Saturday in the first week of December. The report
summarising the last data collected can be found in A789874.
4.8.6. Value for Money
Principles
Every
year the Council commissions a residents survey to seek feedback on their
services and facilities as well as other information to assist them with
planning, management and accountability.
The
survey contains a specific section on the residents view on whether the Nelson
City Council services and facilities are good value for money.
The
results of the survey are published in the Council Survey of Residents report.
Asset Management Plan
2015 - 25
5. Technical
Performance measures/Asset management Systems/lifecycle
This
section details the broad strategies and work programmes required to achieve
the goals and standards outlined within section 4 of the Asset Management Plan.
It
presents the lifecycle management plan for the transport assets, and includes:
· A brief description of the assets;
· Expenditure trends;
· Key issues and strategies for managing these issues;
· Operations, maintenance, and renewal and development
strategies;
· Financial forecasts.
The
transport assets are split as follows:
· Roads;
· Road structures;
· Pedestrian network;
· Cycle network;
· Passenger Transport Network;
· Traffic control and equipment, street lighting, signs and
markings;
· Safety;
· Parking;
· Central Business District.
An
overview of asset lifecycles is provided below which details the key stages in
the asset lifecycle and asset failure. A brief description for the activities
and projects outlined in the Level of Service section and this section is
provided in Appendix K.
5.1. Asset
Lifecycle
Assets
have a lifecycle as they move from initial concept to final disposal. Depending
on the type of asset, its lifecycle varies from 1 year to over 100 years. Key
stages in the asset lifecycle are described in Table 5.1.
Table 5.1 Key
Stages in the Asset Lifecycle
|

|
Asset
planning
|
The
new asset is designed - decisions made at this time influence the cost of
operating the asset and the lifespan of the asset. Other, non-asset
solutions, must also be considered
|
|
Asset
creation or acquisition
|
The
asset is purchased - constructed or vested to Council. Capital cost, design
and construction standards, commissioning the asset, and guarantees by
suppliers influence the cost of operating the asset and the lifespan of the
asset
|
|
Asset
operations and maintenance
|
The
asset is operated and maintained - operation relates to a number of elements
including efficiency, power costs and throughput. Maintenance relates to
preventative maintenance where minor work is carried out to prevent more
expensive work in the future and reactive maintenance where a failure is
fixed
|
|
Asset
condition and performance monitoring
|
The
asset is examined and checked to ascertain the remaining life of the asset -
what corrective action is required including maintenance, rehabilitation or
renewal and within what timescale
|
|
Asset
rehabilitation and renewal
|
The
asset is restored or replaced to ensure that the required level of service
can continue to be delivered
|
|
Asset
disposal and rationalisation
|
A
failed or redundant asset is sold off, put to another use, or abandoned
|
5.2. Asset
Failure Modes
Generally
it is assumed that physical failure is the critical failure mode for many assets.
However the asset management process recognises that other modes are relevant
and are often critical to effective delivery of services.
Table 5.2 Range of Asset Failure Modes
|
Structural
|
The
physical condition of the asset is the measure of deterioration, service
potential and remaining life
|
|
Capacity
|
The
level of under or over capacity of the asset is measured against the required
level of service to establish the remaining life
|
|
Level
of Service Failure
|
Reliability
of the asset or performance targets are not achieved
|
|
Obsolescence
|
Technical
change or lack of replacement parts can render assets uneconomic to operate
or maintain
|
|
Cost
of Economic
Impact
|
The
cost to maintain or operate an asset is greater than the economic return
|
|
Operator
Error
|
The
available skill level to operate an asset could impact on asset performance
and service delivery
|
5.3. Roads
The
service level statement for roads is “Roads are safe to use and provide a
comfortable and reliable means of travel.”
The
last valuation of the roading network was undertaken in June 2014.
Table 5.3 Road
Surface Valuation
|
|
June 2012
|
June 2014
|
|
Quantity
|
2,089,091 m2
|
2,140,850 m2
|
|
Replacement
value
|
$ 24,992,982
|
26,649,423
|
|
Depreciated
replacement value
|
$ 14,545,019
|
14,612,127
|
|
Annual
depreciation
|
$ 1,051,059
|
1,113,452
|
Table 5.4 Road
Basecourse Valuation
|
|
June 2012
|
June 2014
|
|
Quantity
|
2,295,969 m2
|
2,274,622 m2
|
|
Replacement
value
|
$ 33,519,591
|
$ 33,429,410
|
|
Depreciated
replacement value
|
$ 18,766,406
|
$ 15,777,764
|
|
Annual
depreciation
|
$ 313,380
|
$ 364,686
|
The
road network is managed in two ways. Firstly an ongoing maintenance programme
addresses road defects through either planned or responsive maintenance and
secondly roads are renewed or resealed based on a prioritised forward work
programme (repairing those in the worst condition).
Expenditure
Level (from 2012 to 2015)
· Sealed pavement maintenance costs, approx
$469,000/annum. (Reduction from 2009-12 of $94,000/annum.)
· Sealed road resurfacing $1,600,000/annum. (Increase
from 2009-12 of $650,000/annum.)
· Sealed road pavement rehabilitation $0/annum.
(Decrease from 2009-12 by $236,000/annum.)
· Unsealed pavement maintenance costs, approx
$34,000/annum.
· Unsealed road metaling approx $65,000/annum.
· Costs for general management and control of the road
network and management of road asset, approx $481,000/annum.
· Costs for other associated improvements and
maintenance and renewals of drainage, approx $157,000/annum.
· Depreciation approx $1,426,000/annum.
The
Key Issues for Roads
· The major focus of road maintenance is to prevent
water getting into the road base.
· Moisture will soften road base material. We must
ensure use of correct surfacing materials in each road section to optimise the
surface life.
· The quality of road reinstatement work by utility
operators.
· Historically resurfacing has occurred without major
dig outs to fix road base issues.
· Increasing frequency of emergency events with the
potential reduction in NZ Transport Agency co-investment for the recovery and
re-instatement costs.
Strategies
for Managing These Issues
· Ensure both timely resurfacing and good drainage of
the road surface so that it provides an adequate wearing and waterproofing
course to prevent water getting into the road base.
· Develop and adopt a surfacing selection guideline;
regarding placement of asphalt or chipseal, including bus and cycle lanes with
robust site validation processes through visual and experienced based road
asset maintenance assessments.
· An allowance of $200,000 per annum for the recovery of
small scale emergency events has been allowed for under the environmental
maintenance category.
· In response to NZTA changing their
initial advice on the way emergency events would be funded, the emergency works
budget has been reduced to $100,000 per year cumulating.
5.3.1. Asset Condition and
Performance
Every
formed Council owned road is recorded in the Road Asset Maintenance Management
database. This database records pavement and surfacing construction, and maintenance
history, inspection data and traffic volumes.
Road
Asset Maintenance Management surveys are done every second year to assess the
condition of the road pavement and surfacing. Assessments are carried out over
a 50m stretch of every road. Long roads are split into sections. The pavement
condition rating assesses rutting, cracking, potholes and shoving. The
surfacing assessment considers flushing, bleeding, scabbing, ravelling and
delaminating of chipseals, asphaltic concrete and slurry surfaces.
The
road asset condition has been well documented in Section 4.2, 4.3 and 4.4. The
average road roughness across the road hierarchy is below the level of service
standard. The Surface Condition Index shows that the surface condition of roads
has been improving since 2008.
There
is a large section of road network that will exceed the expected life of the
pavement over the next three years. There is also a significant length of the
network that is older than the expected life which might be contributing to a higher
Surface Condition Index than previously experienced.
Table 5.5 Road
Surface Data Reliability Analysis
|
Data Attribute
|
Very Uncertain
|
Uncertain
|
Reliable
|
Highly reliable
|
|
Asset
quantity
|
|
|
|
|
|
Asset
age
|
|
|
|
|
|
Condition
|
|
|
|
|
|
Performance
|
|
|
|
|
Table 5.6 Road
Base Data Reliability Analysis
|
Data Attribute
|
Very Uncertain
|
Uncertain
|
Reliable
|
Highly reliable
|
|
Asset
quantity
|
|
|
|
|
|
Asset
age
|
|
|
|
|
|
Condition
|
|
|
|
|
|
Performance
|
|
|
|
|
The
Council regularly records traffic counts across the city. The counts are
recorded monthly or annually depending on their location. The monthly counts
consist of five sites on the arterial network. Count data is entered into the
Road Asset Maintenance Management database to provide an overall picture of the
network’s traffic use.
5.3.2. Maintenance
Strategy
The
operation and maintenance of Council’s Transport infrastructure is
managed by the Infrastructure Group. The roading maintenance contract was awarded
to Downer EDI Works Ltd in 2010. The contract runs for 3 plus 1 + 1 + 1 years
thus is due for renewal in 2016. The contract allows for the provision of all
road maintenance and includes street and car park cleaning, road markings and
signage.
All
maintenance costs and traffic count data is recorded and inputted into the Road
Asset Maintenance Management database monthly.
A
three year forward works programme has been formulated, based on identified
works contained within the Road Asset Maintenance Management, "all faults
register" and is in the order of $500,000/year for pavement repairs,
present repairs and maintenance. The budget is to cover these works and
unidentified future failures. (Note: Any unidentified future failures will be prioritised
against identified works contained within the all faults register, meaning not
all identified works will be completed within the 3 year funding programme.)
This is an increase of $31,000 over the 2012-15 level to make allowance for the
likely increase in costs from the tender of a new maintenance contract.
The
Council will formulate a resealing policy for urban roads. This policy will
provide guidance on the type of seal to be used whether it is asphalt or road
chip weighing up the whole of life costs of each type of seal.
5.3.3. Pavement
Rehabilitation
Where
Road Asset Maintenance Management data and local observation indicates that
poor pavement structure is critical then generally this is renewed as a
standalone project. A review in 2014 (A1192250) highlighted the following priorities for the 2015-18
period:
· Quarantine Road (SH6 to Nayland Road);
· Maitai Valley Road (4500-4900);
· Wildman Avenue Turning Head;
· Cable Bay Road (1950-2900).
5.3.4. New Roads
It
is unlikely that any new roads will be built by the Council. New roads in
Nelson will come from new subdivisions and the Council will adopt these roads
after the subdivision developer has installed them.
5.3.5. Reseals
Refer
section 4.2.4.
5.4. Road
Structures
The
service level statement for road structures including bridges and retaining
walls is “road structures are considered to be designed and maintained to
provide safe access across the network”.
The
last valuation of the roading network was undertaken in June 2014.
Table 5.7 Bridges
Valuation
|
|
June 2012
|
June 2014
|
|
Quantity
|
44
|
44
|
|
Replacement
value
|
$ 26,414,919
|
$27,199,741
|
|
Depreciated
replacement value
|
$ 17,241,787
|
$ 17,649,524
|
|
Annual
depreciation
|
$ 280,607
|
$ 288,947
|
Table 5.8 Retaining
Wall Valuation
|
|
June 2012
|
June 2014
|
|
Quantity
|
28,111 m2
|
30,852 m2
|
|
Replacement
value
|
$ 44,850,330
|
$ 51,422,169
|
|
Depreciated
replacement value
|
$ 29,735,112
|
$ 37,426,908
|
|
Annual
depreciation
|
$ 658,467
|
$616,972
|
Structures
on the road network are generally managed by undertaking regular inspections to
identify a forward maintenance programme to address defects. New structures are
also built to cater for growth. These are generally built by developers as part
of new subdivisions.
Structures
are classified as a roading asset where they provide support for roads.
Expenditure
Trends (from 2012-2015)
· Preventative retaining wall maintenance costs, approx
$64,000.
· Maintenance on structures approx $72,000/annum.
· Depreciation approx $770,000/annum.
The
Key Issues for Structures
· Ownership of retaining walls.
· Structures approaching the end of useful life.
· Premature failure.
· Seismic capacity for all but lifeline routes not well
understood.
Strategies
for Managing These Issues
· Develop ownership guidelines and investigate as part
of retaining wall condition survey (found assets).
· Continually keep track of structure condition and
maintain as required. Replacing or retrofitting structures as useful life
diminishes.
5.4.1. Asset Condition and
Performance
The
condition of both bridges and retaining walls is recorded in detailed
inspection surveys every six years. Every two years those structures that are
in poor condition or at risk then put on a two year inspection cycle.
The
surveys were last surveyed in 2007 by Tonkin and Taylor. The survey rates each
wall- and bridges general condition on a scale from 1-5 with 1 being of good
general condition and 5 being of poor general condition. A risk assessment of
the likelihood of failure and the expected life expectancy are also estimated.
The last survey was undertaken by Tonkin and Taylor in 2007.
The
average assessed remaining total asset life of the roading retaining walls is
39 years and those walls on cycleways/walkways is 34 years. Eight walls were
identified in the survey as requiring replacement. The spread of remaining
asset life for walls is shown in Figure 5.1.
Figure 5.1 Remaining
Asset Life of Retaining Walls
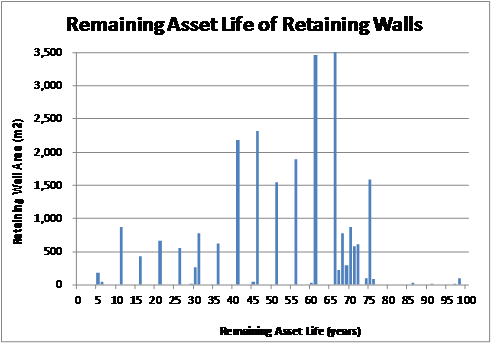
The
detailed survey of bridges are undertaken approximately every 6 years and was
last undertaken over the 2010/2011 summer period by Aurecon. The survey report
details specific defects found during the survey. It also provides a
recommendation for maintenance work and a forward work priority programme. A
seismic review was undertaken on six key structures which were identified in
the previous report as likely to suffer significant damage in the event of a
magnitude 7.5 earthquake. The details of the conditions recorded in the survey
are contained in a Road Asset Maintenance Management database held with the
Council.
The
key structures have a remaining design life of between 25 and 61 years and four
of the seven bridges were identified as requiring earthquake strengthening. It
was found that 22 bridge structures required maintenance work valued at greater
than $5,000.
Table 5.9 Road
Structure Data Reliability Analysis
|
Data Attribute
|
Very Uncertain
|
Uncertain
|
Reliable
|
Highly reliable
|
|
Asset
quantity
|
|
|
|
|
|
Asset
age
|
|
|
|
|
|
Condition
|
|
|
|
|
|
Performance
|
|
|
|
|
5.4.2. Maintenance
Strategy
Repairs
and maintenance of structures are identified through the survey inspection
reports as detailed in Section 5.4.1 or routine inspections undertaken by the
Contractor or Councils contract supervisors. Maintenance is therefore mostly
reactionary to defects identified in surveys rather than preventative
maintenance.
The
current road maintenance contract (to September 2013, with an optional
extension for a further 3 years) specifies the response times for different
repair types, the roles of the Engineer and Contractor, performance
requirements and the basis of payment.
5.4.3. Renewal Strategy
Renewal
of road structure assets will be implemented to maintain a level of service of
an asset by intervening prior to either the end of the useful life of the
asset, or the condition of the asset falling below an agreed level.
The
renewals programme is developed using the recommendations of the bridge and
retaining wall survey reports.
5.4.4. New
Structures/Capital Works
It
is proposed that seismic strengthening of bridges on lifeline transport routes
be funded to provide greater resilience in the event of emergencies. The high
risk bridges proposed to be addressed in the next three years are:
Gibbs
and Poleford Bridge - seismic strengthening, Security of these lifeline bridges
to ensure access to city water supply pipeline up the Maitai Valley in case of
earthquake, design and construction in one year under the Minor Improvement
work category.
New
structures will only be undertaken where new roads are required. New roads are
most likely to be associated with new development so it will be expected that
any structures required will be installed by the developer prior to the council
adopting the roads and structures.
5.4.5. Emergency Works
Structures
are susceptible to damage during natural disasters, in particular flooding and
earthquakes. The recent storm events in the Nelson region highlighted the risk
that exists for the area. Failure of or damage to a bridge or retaining wall
during one of these events would result in emergency works to initially make
the asset useable and also to secure the long term future for the asset.
The
Council can obtain emergency works funding and insurance for events. The
Financial Assistance Rate rates for funding of emergency works has not been
announced yet but Council will still need to provide partial emergency works
funding. The Financial Assistance Rate funding is not always covered for
replacement of damaged retaining walls, even if they are a Council asset. Only
if the walls are supporting the road is there an opportunity to seek funding.
5.5. Pedestrian
Network
The
service level statement for footpaths is “the footpaths network is
considered to be suitable, accessible, safe and well maintained”.
The
last valuation of the roading network was undertaken in June 2014.
Table 5.10 Footpaths
Valuation
|
|
June 2012
|
June 2014
|
|
Quantity
|
494,845 m2
|
481,443 m2
|
|
Replacement
value
|
$ 28,324,783
|
$ 30,043,243
|
|
Depreciated
replacement value
|
$ 8,742,590
|
$ 9,406,454
|
|
Annual
depreciation
|
$ 273,298
|
$ 337,466
|
Table 5.11 Walkways
Valuation
|
|
June 2012
|
June 2014
|
|
Quantity
|
23,067 m2
|
23,067 m2
|
|
Replacement
value
|
$ 3,669,888
|
$ 3,806,273
|
|
Depreciated
replacement value
|
$ 2,619,867
|
$ 2,627,768
|
|
Annual
depreciation
|
$ 38,129
|
$ 40,104
|
The
footpath network is managed in three ways. Firstly an ongoing maintenance
programme addresses footpath defects through either planned or responsive
maintenance. Secondly footpaths are renewed based on a prioritised forward work
programme (repairing those in the worst condition), and thirdly, new footpaths
are built because of health and safety issues, accessibility requirements, or
in response to public requests meeting certain engineering, environmental and
community criteria. These new footpaths are service level improvements and not
growth related. New footpaths are also built to cater for growth. These are
generally built by developers as part of new subdivisions.
Walkways
are classified as a roading asset where they connect roads, are on legal road
and serve for the purpose of providing a route for pedestrians/cyclists with
limited recreational value. There is a register of these which has been agreed
with Parks and Community Facilities.
Expenditure
Level (from 2012 to 2015)
· Maintenance costs, approx $206,000/annum.
· Renewals budget $550,000/annum.
· Capital costs for new footpaths to improve the level
of service vary from $150,000 to $1,000,000/annum depending on scheduled
roading projects.
· New/upgrade walkways $100,000/annum.
· Capital cost for new walkways to improve the level of
service $100,000/annum
· Depreciation approx $280,000/annum.
The
Key Issues for Footpaths
· Demand for footpaths and walkways where previous
development has occurred below the current standards.
· Conflict at crossings between providing a smooth level
surface for mobility scooters and a suitable vehicular access.
· Demand for new and improved footpaths and walkways due
to ageing population.
· Demand for improved lighting of footpaths and
walkways.
· Demand for improved connectivity between footpaths,
and safer road crossings, especially around schools and across the busy
arterials.
· The high cost of providing new footpaths on hillside
and rural streets, and the compromises that are made should a lower standard be
proposed (usually at the detriment of on-street parking, slower vehicle speeds
and the perception of pedestrian safety.
· Improvement in quality of footpath between the Central
Business District and Tahunanui Beach.
5.5.1. Asset Condition and
Performance
Road
Asset Maintenance Management records footpath and walkway condition
assessments. The Council undertakes regular footpath condition assessments
which inform the footpath renewal forward work programme. The most recent
footpath condition assessment has been undertaken by L&M Price for the
entire city in 2014. A summary of the data collected in this assessment is
contained in Table 4.3 in section 4.2.1.
Table 5.12 Footway
Data Reliability Analysis
|
Data Attribute
|
Very Certain
|
Uncertain
|
Reliable
|
Highly reliable
|
|
Asset
quantity
|
|
|
|
|
|
Asset
age
|
|
|
|
|
|
Condition
|
|
|
|
|
|
Performance
|
|
|
|
|
Pedestrian
counts are undertaken every 6 months in 5 locations throughout the city and
comparisons can be made with the 5 year comprehensive survey undertaken in
2010. Reporting of the pedestrian surveys is provided in the Regional Land
Transport Programme and Regional Land Transport Strategy Annual report.
5.5.2. Maintenance
Strategy
Footpath
and walkway repairs are identified through customer notification or routine
inspections undertaken by the Contractor or Councils contract supervisors.
The
current road maintenance contract (to September 2013, with an optional
extension for a further 2 years) specifies the response times for different
repair types, the roles of the Engineer and Contractor, performance
requirements and the basis of payment.
Considerations
which drive the maintenance works include:
· Planned and unplanned work depending upon the urgency
of the response required.
· Footpath and kerb replacement required as a result of
street tree roots.
5.5.3. Renewal Strategy
The
function of the renewal budget is to maintain a level of service of an asset by
intervening prior to either the end of the useful life of the asset, or the
condition of the asset falling below an agreed level.
The
main driver for a renewals programme is Council’s responsibility, as the
custodian of the footpath network to effectively maintain and manage the
lifecycle of the network, on behalf of the ratepayers who own it, for the least
cost over the useful life of that network. The renewals programme shown in
Appendix N has been developed by network services staff using the criteria
outlined below:
· Road Asset Maintenance Management and area wide survey
condition ratings - including an assessment of safety and risk-of-failure, in
other words, a footpath condition-rating scale.
· Use and location - Areas of high pedestrian use (for
example main bus routes, commercial centres), and those with a high public
profile will be one criterion for priority upgrade. Areas that fall into this
category comprise commercial centres (including the Central Business District);
areas around schools; major walkways and cycleways for example.
· Under-grounding or other utility works - The ability
to coordinate footpath upgrade works with under-grounding or other utility
projects offers significant advantages. Mapping of forward programmes may
result in advantages for cost and programming e.g. these include main street
programmes, road renewals, large events such as Central Business District
upgrades and other utilities work programmes.
· Optimisation – alignment with other roading
works to minimise inconvenience to the public (whole of street approach).
All
renewal works aim to comply with the Land Development Manual 2010 footpath
standards, although in some instances, such as hill side streets, or where
crossings are steep, this is not always possible. Staff endeavour at all times
to implement the objectives of the Land Development Manual when renewing
footpaths.
The
footpath renewals contract is included in the road maintenance contract.
5.5.4. New Footpaths and
Walkways
Since
2012, Council has taken a new direction on the planning of future new footpaths
and signs and changing the focus to slowing traffic speeds and making the local
roads safer for all users especially in the hillside areas where it is very
costly to provide footpaths.
New
footpaths and walkways will be constructed from a priority list of missing
footpaths with an annual budget of $200,000. The new footpath schedule can be
found in Appendix M with the live priority matrix in document A777631.
5.6. Cycle
Network
The
service level statement for the cycle network is “the cycle network is
considered to be suitable, accessible, safe and well maintained”.
There
are approximately 20 kilometre of off-road cycleways and 34 kilometres of
on-road cycleways. Part of this network is integrated with footpaths and
carriageways.
‘Cycle
lanes’ is the term used to describe dedicated routes on roads. Shared
walk/cycleways describe off road routes separated from road traffic by either a
kerb or verge, either on road reserve or other Council or NZ Transport Agency
owned land that is identified as a shared utility in the Parking and Vehicle
Control Bylaw schedules. Generally shared walk/cycle paths are 3 metres wide.
Off-road cycleways are generally defined as those outside of the road reserve
and are addressed in the Parks and Reserves Asset Management Plan.
The
last valuation of the roading network was undertaken in June 2014.
Table 5.13 Cycleways
Valuation
|
|
June 2012
|
June 2014
|
|
Quantity
|
65,707
m2
|
71,192 m2
|
|
Replacement
value
|
$
3,735,966
|
$ 4,682,764
|
|
Depreciated
replacement value
|
$
3,371,443
|
$ 4,000,467
|
|
Annual
depreciation
|
$
46,296
|
$ 71,973
|
The
cycleway network is managed in a similar way as the pedestrian network,
identified in 5.5 above.
Expenditure
Level (from 2012 to 2015)
· Maintenance costs approx $65,000/annum since the
completion of the Atawhai cycleway.
· Budgeted capital costs for new cycleways to improve
the level of service vary with significant expenditure over the last three
years implementing the walk cycle schools package of works. This package has
received NZ Transport Agency co-investment from Regional Funds.
· The key issues for shared walk/cycle paths and on road
cycle lanes are:
· Demand to extend and improve cycle linkages (the
current network with planned improvements is shown in Figure 5.2 below.
· Conflict at crossings between cyclists and vehicles
and on shared paths between cyclists, pedestrians and dogs.
· Demand for new and wider shared paths and cycleways.
· Demand for improved lighting and markings on shared
paths and cycleways.
· Broken glass on the shared paths and cycle lanes.
· Removal of cycle facilities during roadworks.
Figure 5.2 Existing
and Proposed Cycle Network
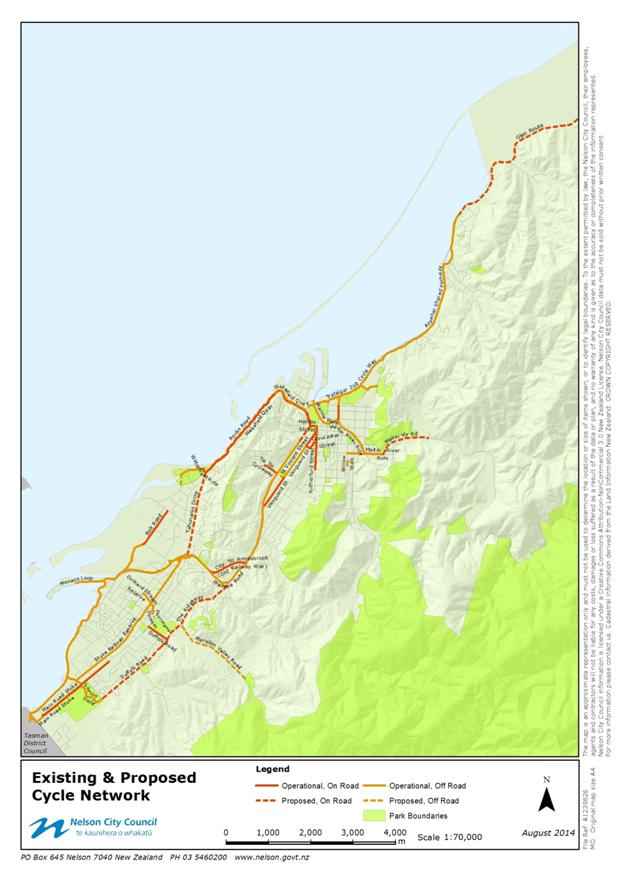
5.6.1. Asset Condition and
Performance
Road
Asset Maintenance Management records shared walk cycleways, although as all the
paths are relatively young (less than 13 years) there has been no condition
assessments carried out to date. Over the last couple of years it is evident
that some older cycleways require some renewal, specifically the coastal route
and the airport bridge. The condition of the on road cycle lanes is managed
with the carriageway infrastructure and line markings and are considered in
section 4.2.3.
Table 5.14 Cycle
Infrastructure Data Reliability Analysis
|
Data Attribute
|
Very Uncertain
|
Uncertain
|
Reliable
|
Highly reliable
|
|
Asset
quantity
|
|
|
|
|
|
Asset
age
|
|
|
|
|
|
Condition
|
|
|
|
|
|
Performance
|
|
|
|
|
Cycle
counts are undertaken every 6 months in 5 locations throughout the city and
comparisons can be made with the 5 year comprehensive survey undertaken in
2010. Reporting on the cycle surveys are provided in the Regional Land
Transport Plan (RLTP) and RLTP Annual Report.
5.6.2. Maintenance
Strategy
Cycle
path repairs and glass removal are identified through customer notification or
routine inspections undertaken by the Contractor or Councils contract
supervisors.
Cycleways
routine maintenance provides for the normal care and attention of the asset to
maintain its integrity and to be fit for purpose. It is a combination of
planned maintenance such as sweeping and reactive maintenance such as patching
and repairing cycleways when complaints by the public are received.
The
current road maintenance contract (to September 2013, with an optional extension
for a further three years) specifies the response times for different repair
types.
Considerations
which drive the maintenance works include:
· Planned and unplanned work depending upon the urgency
of the response required.
· Scheduled improvements planned works.
Cycle
network maintenance costs have historically been $65,000/annum (maintenance -
$35k, sweeping - $15k and Atawhai shared path $15k). However the network has
just been extended significantly by the R funding walk, cycle schoolpackage
(6.1km shared path) in the 2012-15 period with a corresponding increase in
maintenance required. Cycle network maintenance of $80,000 is now necessary to
maintain the level of service.
5.6.3. Renewal Strategy
Renewal
expenditure is major work, which does not increase the assets’ design
capacity but restores, rehabilitates, replaces or renews an existing asset to
its original capacity. Cycleways renewal is undertaken when all or part of a
cycleway has reached the end of its economic life. The required level of
replacement/rehabilitation will depend on age, condition, the level of ongoing
maintenance and useful lives of the materials used.
Renewals
of the following are programmed in the next three years:
· Airport Bridge;
· 1.65km of the coastal path.
5.6.4. New Shared Walk /
Cycleways and Cycle Lanes
A
package of walking and cycling projects ‘R’ is included. An
overview of these projects is identified in the Regional Land Transport Plan
and further detail is provided in Appendix K under the walk/cycle package.
5.7. Public
Transport
Nelson
currently operates two public transport services. They include;
The
NBus including The Late Late Bus[3] (subsidised by Council and NZ Transport Agency);
The
Total Mobility scheme – door to door passenger service for the mobility
impaired (subsidised by Council and NZ Transport Agency).
The
Council also offers a Super Gold Card scheme for pensioners where they get to
travel for free during off peak periods on the NBus. This scheme is fully
funded by central government.
Figure 5.3 Zone
Structure and Bus Routes
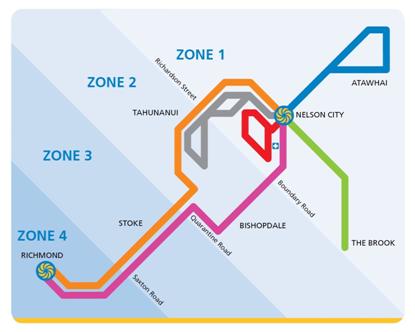
Contract
Structure
The
contract for the NBus and the Late Late Bus services was awarded in March 2012
to SBL Limited. The contract was for 6 years with two two-year extensions if
performance indicators are met. In May 2013, the contract changed from a gross
contract price to a net contract with all fare revenue retained by the
operator. The net contract sum is $535,000 in 2013/14 and is adjusted for
inflation each year. The current contract also allows for the contract price to
be renegotiated if changes in service levels are required.
Key Issues
for Public Transport
· Accessibility to local services / facilities / places
of employment;
· Frequency of bus services, particularly between Nelson
and Richmond;
· Equitable funding from various sources (fares, rates
parking revenue, NZ Transport Agency, Tasman District Council).
· Ageing population resulting in increasing demand for
the total mobility service.
Financial
In
addition to funding from ratepayers and the NZ Transport Agency, a proportion
of the costs are contributed by the user through fares. In 2012/13 63% of the
cost of the NBus and Late Late Bus services was recovered through fares. The
usual funding arrangement for public transport in New Zealand is that the net
cost is funded in equal proportions by the local council(s) and the NZ
Transport Agency. However when the improved NBus service was introduced in
2012, the NZ Transport Agency indicated that it would not be able to increase
its co investment and the funding gap was met using a portion of
Council’s parking revenue. Now that the service has proven itself, the NZ
Transport Agency has confirmed indicated that
Nelson is in a strong position to get matched co investment
in the 2015-18 NLTP. The NZ Transport Agencies preference would be for this
increase to fund a significant improvement to the service, so that
Council’s contribution remains the same. This 2015-25 AMP has no
contribution from the parking account to public transport with the local share
now being fully funded from rates.
Table 5.15 Fares as
at July 2014
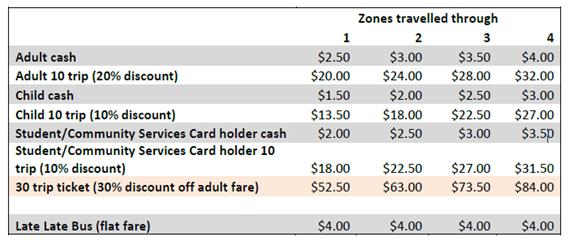
5.7.1. Improvement
Strategy
The
following priorities for public transport have been identified in the 2013
review of the NBus service[4] in order to increase patronage:
· Lower fares to increase patronage and then review fare
structure every two years.
· Increase the frequency of the bus service on arterial
routes between Nelson and Richmond and to encourage an increase in patronage.
· Continue marketing and promotion of new, improved, or
altered services.
· Review the provision of bus stops and shelters and
prioritise infrastructure improvements.
· Conduct user and non-user surveys every 2 years and
use feedback to improve services.
· Construct additional infrastructure on hail and ride
rates to increase visibility of service.
· Improve coverage of bus service in Stoke.
In
2014 Council carried out a business case assessment in order to obtain
additional funding from NZ Transport Agency to implement the improved coverage
in Stoke and to inform the Regional Public Transport Plan. The outcomes of the
business case will be determined by NZ Transport Agency during the RLTP
moderation process. The Business Case
successfully obtained co-investment from NZ Transport Agency for increased bus
coverage in Stoke.
The
following priorities for total mobility have been identified:
· Increase funding at 6% per annum for the 2015-2025
period to meet the demand caused by the ageing population for the service.
5.7.2. Future
Public Transport Study
A
public transport review is planned to occur every five years with the next
review scheduled in 2019/20.
The
full scope of the review is yet to be established but it is likely this will
entail assessing the suitability of the public transport network and whether
changes should be made to bus routes and if new routes are required.
5.8. Traffic
Control and Equipment, Street Lighting, Signs and Markings
The
service level statement for the transport assets in this section are:
· Traffic signals are designed and maintained to
optimise traffic flow in the roading network.
· Street lighting is provided and maintained to enable
safe and easy night driving on all urban streets and to outdoor public spaces
were night time pedestrians movements dominate e.g. Central Business District
areas.
· Appropriate signage is maintained to enable safe and
efficient way finding across the transport network.
· Road markings are maintained to provide clear
delineation and direction for roads, parking, and cycle and bus lanes at all
times.
The
last valuation of the roading network was undertaken in June 2014.
Table 5.16 Street
Signs Valuation
|
|
June 2012
|
June 2014
|
|
Quantity
|
2,882
|
2,882
|
|
Replacement
value
|
$ 1,590,864
|
$ 1,809,896
|
|
Depreciated
replacement value
|
$ 795,432
|
$ 904,948
|
|
Annual
depreciation
|
$ 106,058
|
$ 120,660
|
Table 5.17 Line
Marking Valuation
|
|
June 2012
|
June 2014
|
|
Quantity
|
|
|
|
Replacement
value
|
$ 120,000
|
$ 120,000
|
|
Depreciated
replacement value
|
$ 120,000
|
$ 120,000
|
|
Annual
depreciation
|
$120,000
|
$120,000
|
Table 5.18 Streetlights
Valuation
|
|
June 2012
|
June 2014
|
|
Quantity
|
4,291
|
4,433
|
|
Replacement
value
|
$ 20,237,614
|
$ 34,648,552
|
|
Depreciated
replacement value
|
$ 10,685,803
|
$ 17,226,538
|
|
Annual
depreciation
|
$ 556,932
|
$ 796,011
|
Table 5.19 Traffic
Signals Valuation
|
|
June 2012
|
June 2014
|
|
Quantity
|
12
|
13
|
|
Replacement
value
|
$ 1,858,069
|
$ 3,513,748
|
|
Depreciated
replacement value
|
$ 821,884
|
$ 1,959,584
|
|
Annual
depreciation
|
$91,115
|
$ 139,368
|
These
roading assets are an important activity for the Council to manage as they
provide important information and direction to all road users. The Council
seeks to ensure that this is done so that the transport network is safe,
legible and efficient.
Expenditure
Trends (from 2012 to 2015)
· Maintenance costs of signs, markings and street
lighting and furniture, approx $930,000/annum.
· Renewal costs of signs, markings, street lighting and
furniture and traffic signals, approx $130,000/annum.
· Operation and maintenance of traffic signals, approx
$78,000/annum.
· Depreciation approx $930,000/annum.
The
Key Issues
· Lack of road sign asset knowledge.
· Street lighting poles that are in a poor condition and
luminaries that have reached the end of their serviceable life.
Strategies
for Managing These Issues
· Develop inventory for street signs.
· Use pole testing results to target replacement of at
risk poles.
· Replace poor performing luminaries with LED’s.
5.8.1. Asset Condition and
Performance
The
Council requires a sign inventory to be undertaken so that the location and
condition of all signs and supports are recorded into Road Asset Maintenance
Management. It is estimated that this will cost $50,000.
The
traffic signal asset is in a very good condition with recent controller and LED
upgrades.
Sign
condition is monitored by the road maintenance contractor and signs that fall
below standard are programmed to be replaced.
There
are still a considerable number of Mercury Vapour/Fluorescent lights all over
the city. These should be replaced wherever possible with LED technology to
improve light output and reduce energy consumption. Lighting poles are in the
process of being inspected for structural integrity. Refer to document A1224555
5.8.2. Renewal Strategy
There
are no planned renewals for the traffic signal asset in the first three years.
The
streetlight renewal budget of $200,000/annum will be used to improve street
lighting, focussing on:
· Safety of all users;
· Renewal of aged mercury vapour and fluorescent
luminaries;
· Improving the energy efficiency of the streetlight
network by installing LED’s;
· Replacing rusty pole bases;
· Reducing light pollution with the Dark Sky policy.
The
Council has a “Dark Sky” policy when it comes to new or improved
street lighting. This policy has been adopted to limit the amount of light
pollution emitted directly up from street lights.
5.8.3. New Assets
There
are no new traffic signals planned in the next five years.
Along
with street lighting renewal to improve lighting levels there will be new
street lighting also incorporated into the following upgrade projects.
· Rocks Road walking and cycling;
· Milton, and Halifax upgrades.
5.9. Safety
The
service level statement for safety is:
“To
work towards a safe road system increasingly free of death and serious
injury.”
The
following objectives relate to the NZ Transport Agency work category (432) on
road safety in particular promotion, education and advertising. This work
category provides for the development and implementation of activities that
address the safe use of the land transport network.
Objectives
· Advancing the priorities and initiatives identified in
the Safer Journeys Strategy and its action plan (www.saferjourneys.govt.nz).
· Achieving safer outcomes by working with communities
to identify and deliver local land transport safety issues.
· Developing and motivating national, regional and local
land transport safety partnerships to ensure an integrated approach to safety
outcomes.
Strategic
Fit To the Nelson Region
The
2014 NZ Transport Agency Communities at Risk Register;
· shows Nelson City to have low individual risk for
cyclists;
· shows older drivers in Nelson are at below average
individual risk for a crash;
· shows Nelson to have medium individual risk for pedestrians;
· shows young drivers to be at low individual risk in
Nelson City but are a high priority nationally;
· Safer Speeds is also identified as a high priority in
the Safer Journeys strategy.
Current
Road Safety Performance
The
analysis in Section 4.4 indicates that road safety has improved markedly from
the period covered by the previous AMP. The target for road safety performance
has been changed to move away from statistics that compare Nelson with the peer
group average and instead towards a fixed baseline. This will allow a direct
measure of the improvement in Nelson alone without a particularly good or bad
year in the other centres influencing whether the targets have been met
locally.
In
order to achieve the gains in road safety that have been realised in the last
three to five years the Council has run a variety of initiatives and campaigns
that are summarised by transport mode below. In the 2012-2015 period $147,000
per annum was budgeted.
Cycling
The
initiatives for improving cycle safety are Nelson’s RIDE ON Strategy,
0800 CYCLECRASH and Be Bright on a Bike. Key outcomes are to improve community
cycle skills, encourage more cycle use, drawing attention to cycle presence on
the road and a reduction in crashes involving cyclists.
Motorcycling
The
initiative for improving motorcycle safety is the “Top of the South
Motorcycle Safety Programme. Key parts to the strategy are motorcycle training
courses together with information publicised on licence requirements and safety
gear as two closest neighbours Tasman and Marlborough District Council have
medium casualty risk rating for motorcycles.
Older
Drivers
The
initiatives for improving safety with Nelson’s older drivers are the
Staying Safe, Car Fit and Mobility Scooter Training schemes. Key parts to
achieve this are classroom based learning on staying safe and one to one
mobility scooter training and support. A Car Fit package helps older drivers
recognise what their vehicle’s safety features are and assists in
correctly adjusting them to their personal needs.
Speeds
and Driving to the Conditions
The
initiatives for reducing driver speeds will focus on driver education and
awareness in particular to driving within residential streets. It is hoped that
a greater ownership of streets and public space by residents can be achieved by
investigation and implementation of a community development model to reduce
speeds in residential streets.
Walking
The
initiatives for improving safety while walking focuses on young pedestrians and
parents of child pedestrians. The work will involve walking school buses and
Feet First and Walk to School promotions. Other events and activities designed
to promote and encourage using active transport as a mode of travel to and from
school will be utilised.
Younger
Drivers
The
initiatives for improving safety amongst young drivers are Rotary Young Driver
Awareness (RYDA), Students Against Dangerous Driving (SADD) and the training of
teachers in delivering road safety across the school curriculum. Key outcomes
are to provide increased awareness in the target group of young drivers and
their parents about elevated risk levels and steps that can be taken to reduce
that risk.
Road
Safety Action Plan
The
Council has a joint road safety action plan with the Tasman District Council.
This plan is a critical component in the delivery of a Road Safety programme
across the Nelson/Tasman district. The two councils through resolution have
agreed to a cluster arrangement for the purpose of delivering a road safety
programme across their respective districts. For management purposes a Joint
Road Safety Action Plan Committee has been appointed with representatives from
key stakeholder groups.
The
Road Safety Action Plan Committee is tasked with the management of all road
safety activities. To enable this, a supporting structure has been developed
which includes:
· Three times a year council led and chaired Road Safety
Action meetings, which include formal agendas and stakeholder reporting lines
and minutes.
· Operational meetings for professional key staff as and
when required with meeting recordings made.
· Planning processes and operational calendars and works
schedules as attached.
The
goal of the plan is to contribute to the Governments Safer Journey initiatives
which aim to reduce road user crash risks and consequences. The plan
acknowledges the Governments Safer Journeys initiatives and that even a
responsible driver may make mistakes on our local roads. It is the goal of this
plan to better manage our road networks, our vehicles, our users and crash
forces to deliver a safe system across the Nelson/Tasman sub region.
To
achieve the goals of the plan the Road Safety Action Plan aims to:
· Fully understand crash risk on our road networks.
· Redesign our high risk road infrastructures to be predictable,
forgiving of mistakes and self explaining.
· Manage our local roads to ensure that the travel
speeds suit the function and safety level for the road environment and
conditions.
· Manage local vehicles to ensure they are safe and road
worthy.
· Ensure that all road users are skilled, competent,
alert, unimpaired, comply with the road rules and take steps to improve their
safety.
The
improvements in road safety that have resulted in all of Nelson previously
medium to high risk user groups dropping to low risk on the High Risk
Communities Register have been as a result, in part to the programmes and
initiatives detailed above. In order to maintain this safety improvement and
make further gains Council needs to continue to be proactive with road safety
campaigns and initiatives that include speed reduction measures.
5.10. Parking
The
service level statement for parking is “Parking is easy to use, and is
rationed fairly and equitably”.
The
last valuation of the roading network was undertaken in June 2014.
Table 5.20 Car
Parking Valuation
|
|
June 2012
|
June 2014
|
|
Quantity
|
36,207m2
|
33,892 m2
|
|
Replacement
value
|
$ 2,600,849
|
$ 2,777,088
|
|
Depreciated
replacement value
|
$ 831,756
|
$ 660,919
|
|
Annual
depreciation
|
$ 32,985
|
$ 32,280
|
Council
has eight car parks, two in Stoke (237 parks) and six in the Central Business
District (871 parks). The number of spaces in each park is identified in Table
5.25.
Table 5.21 Car
Parking Spaces in Nelson and Stoke
|
ID
|
Location
|
Number of spaces
|
Parking Type
|
|
1
|
Strawbridge Square (Stoke)
|
180
|
time restricted
|
|
2
|
Putaitai Street/Fire Station Car Park
(Stoke)
|
57
|
time restricted
|
|
3
|
Tahaki Street (Nelson Library)
|
59
|
time restricted
|
|
4
|
Millers Acre
|
92
|
metered
|
|
5
|
Wakatu Square
|
173
|
metered
|
|
6
|
Buxton Square
|
229
|
metered
|
|
7
|
Montgomery Square
|
268
|
metered
|
|
8
|
Betts Car Park
|
52
|
leased to individual users
|
|
9
|
Bridge Street Car Park
|
|
leased to individual users
|
|
|
Total
|
1108
|
|
Table 5.22 Car
Parking Data Reliability Analysis
|
Data Attribute
|
Very Uncertain
|
Uncertain
|
Reliable
|
Highly reliable
|
|
Asset
quantity
|
|
|
|
|
|
Asset
age
|
|
|
|
|
|
Condition
|
|
|
|
|
|
Performance
|
|
|
|
|
Parking
and public transport are intrinsically linked. Changes to the parking charge
may affect the use of public transport. Free parking would discourage use of
public transport, requiring increased enforcement or increases in the
commercial rate to ensure funds were available to operate, maintain and improve
the Central Business District.
In
Nelson there is a lack of long term parking spaces within the Central Business
District and the Council does not plan to add any more long term parking
capacity. Along with parking charge rates the Council wish to maintain a
central city parking regime that is incentivised for people to use public
transport and active modes.
Expenditure
Trends (from 2012 to 2015)
· Carpark maintenance costs approx $266,000/annum;
· Carpark lease costs $167,600/annum;
· Carpark rate costs $324,000/annum.
The
Key Issues for Car Parking
· Maximum Parking occupancy exceeding the desired level
of service at 85% in the surveyed first week of December in the Central
Business District core.
· Perception of heavy handed enforcement.
· Long-stay commuters occupy a significant proportion of
the short stay inner city parking.
· Condition monitoring and rating, maintenance and
replacement of signage and marking affect the effectiveness of parking
restriction enforcement.
· Frequent requests for no-stopping lines.
· Payment methods out of date with current technologies.
Strategies
for Managing These Issues
· Optimise time limits to reflect car parking demand.
· Replace parking meters in 2017/18 with a more flexible
payment facility.
· Trial different parking regimes in order to determine
best fit for the Nelson CBD users.
·
5.10.1. Asset Condition and
Performance
Off-street
car parks have been incorporated and included into the Road Asset Maintenance
Management database.
Car
parking meters were renewed in 2006 to ensure compliance with the new currency
and will be coming to their end of life in 2017/18. The maintenance costs for the
meters have not increased significantly as their end of life has approached
however the need to introduce more convenient ways to pay such using credit and
debit cards including Pay Wave will drive the replacement date.
Summary
of 2008 and 2012 Car Parking Data Collection Reports
· 815 parks are available in the four Central Business
District squares – approximately 25% used by all day commuters;
· There is enough short-stay capacity if the
long-stayers stopped using the short stay spaces;
· Short stay parking should be of sufficient capacity,
carefully costed, well-located and accessible;
· Long Stay parking should not compete with short stay
capacity, and should align with the wider transport policy.
Potential
Methods to Manage Parking Square Enforcement
· Continue existing pay and display system (note:
tickets can only be issued if money is paid);
· Install barrier arms and new meters (cost estimate
$300,000 per square) for a “pay as you exit system”;
· Change bylaw to more clearly limit the length of time
allowed in a parking square per day.
Parking
Revenue
· In 2012/13 $428k was received from on-street meters
and $712k from off-street meters. It ahs been estimated that under the current
one hour free then $1.50/hr that the total revenue from the meters will be in
the order of $460K pa.
· Infringement recoveries ($838k received in 2012/13)
fund parking regulation enforcement.
Implementation
Plan for Parking
· Renew pay and display meters with units that enable
payment by credit card and integration with smart phone apps to extend the
stay, $470,000 in 2017/18 and $470,000 in 2018/19.
· Install signage directing users to the parking squares
from the CBD ring route, $200,000 in 2015/16 and $100,000 in 2016/17.
· Reconfigure the traffic signals on Main Road Stoke at
the Putaitai intersection to allow the right turn out to prevent unnecessary
movements through Strawbridge Square carpark, $40,000 in 2015/16.
· Modify the tree planters in Strawbridge Square carpark
to minimse damage, $30,000 in 2015/16.
· Allocate a small number of campervan and motor home
spaces within the CBD, $20,000 in 2016/17.
|
Roading
Asset Valuation
|
|
|
|
|
|
Asset
Category
|
June
2014
|
|
Quantity
|
Units
|
RV
($)
|
DRV
($)
|
Depr
($)
|
|
Pavement
Layers
|
|
|
|
|
|
|
Formation
|
2,943,138
|
m3
|
105,952,978
|
105,952,978
|
|
|
Sub-base
|
385,000
|
m3
|
40,810,048
|
40,810,048
|
|
|
Basecourse
|
2,274,622
|
m2
|
33,429,410
|
15,777,764
|
364,686
|
|
Surfacing
|
2,140,850
|
m2
|
26,649,423
|
14,612,127
|
1,113,452
|
|
Drainage
|
|
|
|
|
|
|
Intakes
|
57
|
units
|
287,215
|
213,791
|
3,590
|
|
Outfalls
|
37
|
units
|
141,229
|
91,719
|
2,026
|
|
Sumps
|
6,185
|
units
|
14,445,169
|
9,548,638
|
160,449
|
|
Stormwater
pipes
|
74,456
|
m
|
31,254,587
|
18,344,137
|
365,090
|
|
Culverts
|
3,578
|
m
|
3,070,782
|
1,492,914
|
34,714
|
|
Kerb
and Channel
|
339,426
|
m
|
21,527,541
|
10,991,856
|
282,476
|
|
Kerb
Only
|
13,480
|
m
|
899,166
|
569,484
|
12,920
|
|
Dished
Channels
|
26,751
|
m
|
2,360,180
|
334,096
|
40,377
|
|
Regulatory
|
|
|
|
|
|
|
Signs
|
2,882
|
units
|
1,809,896
|
904,948
|
120,660
|
|
Electronic
Signs
|
30
|
units
|
262,920
|
237,018
|
21,910
|
|
Posts
|
1,758
|
units
|
153,913
|
76,956
|
10,261
|
|
Handrails/Sight
Rails
|
6,443
|
m
|
836,134
|
418,067
|
27,871
|
|
Guardrails
|
1,219
|
m
|
915,311
|
457,655
|
18,306
|
|
Edge
Marker Posts
|
441
|
units
|
9,993
|
4,997
|
1,999
|
|
Speed
Tables
|
36
|
units
|
936,000
|
633,100
|
23,400
|
|
Road
Humps
|
20
|
units
|
29,640
|
14,820
|
1,186
|
|
Raised
Pavement Markers
|
1,531
|
units
|
26,808
|
13,404
|
2,234
|
|
Road
Markings
|
|
|
120,000
|
120,000
|
|
|
Traffic
Signals
|
|
|
3,513,748
|
1,959,584
|
139,368
|
|
Streetlights
|
|
|
|
|
|
|
Streetlights
|
4,433
|
units
|
34,648,552
|
17,226,538
|
796,011
|
|
Structures
|
|
|
|
|
|
|
Bridges
|
44
|
units
|
27,199,741
|
17,649,524
|
288,947
|
|
Retaining
Walls
|
30,852
|
m2
|
51,422,169
|
37,426,908
|
616,972
|
|
Fords
|
3
|
units
|
84,781
|
57,798
|
848
|
|
Footbridges
|
28
|
units
|
1,250,597
|
862,480
|
12,506
|
|
Other
|
|
|
|
|
|
|
Land
for Legal Road
|
|
|
256,096,995
|
256,096,995
|
|
|
Footpaths
|
481,443
|
m2
|
30,043,243
|
9,406,454
|
337,466
|
|
Walkways
|
23,067
|
m2
|
3,806,273
|
2,627,768
|
40,104
|
|
Cycleways
|
71,192
|
m2
|
4,682,764
|
4,000,467
|
71,973
|
|
Carparks
|
33,892
|
m2
|
2,777,088
|
660,919
|
32,280
|
|
CCTV
|
18
|
units
|
101,250
|
67,693
|
20,250
|
|
Misc
Street Furniture
|
635
|
|
1,508,363
|
657,563
|
53,682
|
|
TOTAL
|
|
|
|
703,063,905
|
570,321,205
|
5,018,012
|
7. Financial
Forecasts and Development Contributions
Expenditure
on assets can be categorised into the following main areas which are discussed
below.
Operations
and Maintenance
Operation
and Maintenance expenditure is required for the day-to-day operation of the
network whilst maintaining the current level of service.
Maintenance
costs are generally subdivided into:
· Routine – ongoing day to day maintenance;
· Planned – Non day to day maintenance that is
planned in advance;
· Reactive – Maintenance that is unexpected.
Renewals
Renewal
expenditure includes rehabilitation and replacement of assets to restore an
asset to its original level of service.
Capital
Capital
works involves the creation of new assets, or works, which upgrade or improve
an existing asset beyond its current capacity or performance.
The
forecasted subsidised annual expenditure for the next three years is shown in
Table 7.1.
Asset
Management Assumptions
· The forecast are based on current NZ Transport Agency
funding thresholds and co-investment levels.
· Maintenance and operations allocations are largely
based on maintaining current level of service.
· Do not allow for fuel prices or inflation escalation.
· Staff resources will be available to commission all
the actions required.
Table 7.1 Forecasted
Subsidised Annual Expenditure
|
Activity Class
|
2015/16
|
2016/17
|
2017/18
|
|
Transport
planning
|
$45,000
|
$70,000
|
$105,000
|
|
Road
safety promotion
|
$90,000
|
$90,000
|
$90,000
|
|
Walking
and cycling facilities
|
$280,000
|
$605,100
|
$570,000
|
|
Public
transport services
|
$1,293,300
|
$1,281,800
|
$1,332,200
|
|
Public
transport infrastructure
|
$69,300
|
$131,900
|
$36,000
|
|
Maintenance
and operation of local roads
|
$3,135,900
|
$3,148,600
|
$3,161,500
|
|
Renewal
of local roads
|
$2,691,800
|
$2,394,800
|
$2,538,100
|
|
New
& improved infrastructure for local roads
|
$650,000
|
$650,000
|
$700,000
|
|
Total
Forecasted Expenditure
|
$8,255,300
|
$8,372,200
|
$8,532,800
|
Other
Significant Sources of Council Funding
· Rates – in addition to funding from rate
payers. Inner city and Stoke CBD ratepayers pay a higher differential to
cover provision of special services in the CBD’s.
· Parking charges and enforcement.
· Property rents and land leases.
· Development Contributions – see below.
· Borrowing – the Council raises loans to fund
capital works only.
· Depreciation – the Council depreciates its
assets according to the replacement value method in order to fund renewal
projects and repay Council debt.
Development
Contribution
In
addressing actual and potential adverse effects from Developments, the Council
may seek financial contributions.
This
will go towards the necessary land and works to construct, widen or upgrade any
new or existing road, where:
· roads are not available; or
· existing roads are of inadequate width or construction
to cater for increase usage caused by the subdivision or development; or
· alterations or works to existing roads are required
for traffic safety or efficiency as a consequence of the subdivision or
development.
Furthermore,
a financial contribution may be sought when the full number of on-site parking
spaces is not provided as per the Resource Management Plan.
The
LTP shows a programme of expected works for the ten years to 2025. This
includes yearly financial forecasts of income and expenditure on transport
activity operations and renewals and new capital expenditure. The LTP is
included in Appendix L. Please note that these figures in this AMP are based on
2015 estimates and do not include inflation. The LTP figures differ beyond year
1 as they do include an allowance for inflation.
Background
Risk
management is the systematic application of management policies and procedures
to identify, analysis, evaluate, treat and monitor risk so that injury to
people, damage to the environment, financial loss, disruption to
infrastructural assets and services and legal obligation failures are
controlled and mitigated as far as practicable.
Analysis
of Risks
Council’s
risk management framework is consistent with the joint Australian New Zealand
Standard (AS/NZ IS4360:2004), to ensure that risks are managed on a consistent
basis.
Risk,
likelihood and consequence are defined as:
· Risk is a function of the likelihood and consequence
of an event occurring;
· Likelihood is the probability or frequency of an event
occurring;
· Consequence is the outcome of an event including a
loss, injury, disadvantage or gain.
For
each event the likelihood score (Table 8.1) is multiplied by the consequence
score (Table 8.2) for each area of impact. These multiples are then totalled to
produce the risk priority rating for the event (Table 8.3), which provides an
assessment of the level of risk associated with the event.
Table 8.1 Likelihood
Ratings (Semi Qualitative Measure)
|
Rating
|
Description
|
Score
|
|
A
|
Almost
Certain
|
Likely
to occur frequently, i.e. several times a year.
|
0.9
|
|
B
|
Likely
|
Likely
to occur more than once during the life of the project.
|
0.7
|
|
C
|
Moderate
|
Likely
to occur during the life of the project.
|
0.4
|
|
D
|
Unlikely
|
Might
occur once in 100 years.
|
0.2
|
|
E
|
Rare
|
Might
occur once in 100+ years.
|
0.01
|
Table 8.2 Semi-Quantitative
Measures of Consequence and Areas of Impact
|
Areas of Impact
|
Consequence
|
|
Negligible (10)
|
Minor (30)
|
Moderate (50)
|
Major (70)
|
Catastrophic (100)
|
|
Health
and Safety
|
Minor
injury possible.
|
Serious
injury to one person.
|
Serious
injury to multiple members of staff, contractors or public.
|
Single
fatality of staff, contractor or public.
|
Multiple
fatalities of staff, contractors or public.
|
|
Public
Health
|
Temporary
but non-serious health impacts.
|
Localised
serious health impact on one person.
|
Localised
serious health impact on more than 20 people.
|
Localised
or widespread serious health impact on more than 100 people.
|
Localised
or widespread serious health impact on more than 1,000 people.
|
|
Asset
Performance
|
Asset
failure impacting on one or more persons.
|
Asset
failure impacting on more than four people
|
Asset
failure impacting on more than 40 people
|
Asset
failure impacting on more than 400 people
|
Asset
failure impacting on more than 4000 people
|
|
Environment
and Legal Compliance
|
Short
term and Temporary impact requiring no remedial action.
|
Medium
term environmental impact with negligible effects on environment or
community.
|
Measurable
environmental harm to an internationally or nationally significant site. Loss
of public access or conservation value of the site.
|
Major
environmental damage requiring long-term recovery investment. High profile
legal challenge. Loss of public access or conservation value of a significant
environment.
|
Permanent
environmental damage to an internationally or nationally significant site.
Large scale class action.
|
|
Historical
or Cultural
|
Loss
of important records about a site. Work required restoring them.
|
Unsympathetic
development compromising the integrity of a registered historical, cultural
or archaeological site.
|
Damage
to a registered historical, cultural or archaeological site, but capable of
restoration.
|
Loss
or permanent damage to a registered historical, cultural or archaeological
site.
|
Permanent
loss of national icon.
|
|
Financial
|
Capital
cost/ loss <$100k.
|
Capital
cost/loss $100k - $500k.
|
Capital
cost/loss $500k - $1million.
|
Capital
cost/loss $1million- $5million.
|
Capital
cost/loss > $5 million.
|
|
Customer
Perception
|
Service
Request.
|
Minor
complaint.
|
Justifiable
complaint / information request.
|
Ministerial
questions /third party investigations.
|
Public
or ministerial enquiry.
|
Table 8.3 Risk
Priority Rating (Semi Quantitative)
|
Rating
|
Level of Risk
|
Score
|
|
>
200
|
Extreme
|
Awareness
of the event to be highlighted to Council.
|
|
150
- 200
|
High
|
Risk
treatment required. Risk to be eliminated or mitigated by 30 June 2009 to
comply with Infrastructural Assets Business Plan.
|
|
100
- 150
|
Moderate
|
Risk
treatment required.
|
|
0
- 100
|
Low
|
Manage
by routine procedures.
|
The
potential risks to Transport assets and services include:
· Legislative;
· Operational;
· Organisational;
· Public health and safety.
A
simplified summary with proposed mitigation actions has been provided in Table
8.4 and Table 8.5.
Table 8.4 Business Risk
Schedule
|
No.
|
Risk Event
|
Consequence
or Outcome
|
Mitigation
Strategies
|
Gross Risk
|
Action Plan
|
Residual
Risk
|
|
1.
|
High level
policies, procedures and controls
|
|
1.1
|
Resource
Consent Conditions on road reserve not in accordance with Councils planning
|
Infrastructure
developed through Resource Consent not in accordance with Land Development
Manual, Policy or in alignment with councils future transport planning
|
All staff to
ensure future RC conditions are non-binding on road reserve.
|
High
|
None
|
High
|
|
1.2
|
Inaccurate
growth information
|
Inappropriate
decision made about future infrastructure and services
|
Growth
monitoring to be frequent and trends related to national/international data
where possible
|
Mod
|
Monitoring
regime now established
|
Low
|
|
1.3
|
Increasing
standards
|
Public
expectations of Transport safety, quality and environmental standards are
increasing
|
|
Mod
|
The
implications of increased levels of service, resulting in increased
expenditure are fully recognised by Councillors
|
Low
|
|
2.
|
Financials
|
|
2.1
|
Poor
financial forecasting
|
Reflects on
Council as poor planning
|
Ensure
assumption to project cost estimates are fully understood and refine
estimates before each Annual Plan is developed
|
Mod
|
Ensure robust
project management practices are followed
|
Mod
|
|
2.2
|
Desired NZ
Transport Agency funding not obtained
|
Additional costs
to Council or implementation of projects delayed, or maintenance deferred
|
Monitor NZ
Transport Agency funding procedures and manuals and submit application in a
timely manner
|
Mod
|
Ensure
politicians are fully informed
|
Mod
|
|
2.3
|
Non-compliance
with NZ Transport Agency funding agreement
|
Reduction or
refund of NZ Transport Agency contributions
|
Annually
report on compliance requirements
|
Mod
|
Implement
measures to address any non-compliance
|
Low
|
|
3.0
|
Organisation
Management
|
|
3.1
|
Failure to
act on identified risk
|
Potential
legal action against Council
|
|
Mod
|
Identified
risk improvements implemented
|
Low
|
|
3.2
|
Lifelines
plan not completed, updated or implemented
|
Lifeline
asset failure reducing effectiveness of Nelson Tasman Emergency Management
Group Plan 2005. Failure to comply with Civil Defence Emergency Management
Act
|
|
High
|
Complete and
update Lifelines implementation plan
|
Low
|
|
3.3
|
Asset
Management Plan improvement plan not undertaken
|
Future
forecasting not accurate. Decision making not optimised.
|
Annually report
on improvement plan
|
Low
|
|
Low
|
|
4.0
|
Health and
Safety
|
|
4.1
|
Safety
Management Strategy and System for roads not implemented
|
Safety levels
of service perceived not to have been achieved (although in reality works
being undertaken but without the overarching structure)
|
|
Mod
|
Continue to
monitor crash rates and set interventions via the TAMP
|
Mod
|
|
4.2
|
No agreed
procedure with Police for road closure or traffic light failure event
|
Reduced
safety leading to increased accident risk
|
Establish a
Police traffic emergency procedures process as identified in OFI 6 of SMS
|
High
|
Establish a
Police traffic emergency procedures process as identified in OFI 6 of SMS
|
Low
|
|
5.0
|
Transport
Asset Management
|
|
5.1
|
Asset
Management Plan not fully implemented
|
LTP, RLTP and
Annual Plan not fully implemented resulting in recognition of poor Council
performance and public dissatisfaction
|
Ensure robust
project management practices are followed
|
High
|
Ensure robust
project management practices are followed
|
High
|
|
5.2
|
Performance monitoring
of levels of service not completed
|
Levels of
service not met resulting in public dissatisfaction
|
Establish and
implement monitoring programme
|
Low
|
Review every
three years
|
Low
|
|
5.3
|
Non
compliance with Land Development Manual for constructed/adopted assets
|
Substandard
works requiring greater maintenance or earlier renewals
|
Project Scope
and plan and site check procedures to be sufficiently resourced and
implemented
|
High
|
Project Scope
and plan and site check procedures to be sufficiently resourced and
implemented
|
Mod
|
|
5.4
|
Unauthorised
construction on road reserve
|
Public
liability risk to Council. Risk of underground service damage
|
|
High
|
Establish and
implement monitoring programme to ensure all approvals (including street
opening notices and Traffic Management Plans) are obtained
|
Mod
|
|
5.5
|
Network
modelling and condition assessments not applied
|
Capital and
renewals works programme not optimised. Future forecasting not accurate
|
Road Asset
Maintenance Management database and traffic models regularly updated and
assessed
|
High
|
Road Asset
Maintenance Management database and traffic models are regularly updated and
assessed
|
Low
|
|
5.6
|
Lack of
funding available to cover recovery cost triggered by a natural event
|
Additional
rates burden
|
Increase
insurance
|
High
|
Budget an
increased internal contingency fund and investigate insurance costs to cover
the unsubsidised portion of any emergency events
|
Low
|
|
5.7
|
Significant
Natural Event
|
Resources reapportioned
as necessary which might compromise Asset Management Plan implementation.
Potential public claims from a lack of understanding of the risks
|
Delay
implementation of this plan and reviewed modify as necessary when resources
re-established
|
High
|
Preliminary
risk maps of areas particular susceptible to flooding, liquefaction, tsunami,
slips and fault lines to be mapped and published
|
Low
|
Table 8.5 Asset Risk Schedule
|
No.
|
Risk Event
|
Consequence
or Outcome
|
Mitigation
Strategies
|
Gross Risk
|
Action Plan
|
Residual
Risk
|
|
1.0
|
Road
pavements (including footpaths, cycleways and car parks)
|
|
1.1
|
Structural
failure/blockage due to earthquake or landslide
|
Pavement
failure and road closure
|
Maintenance
contractor has 24 hour call out facility
|
Low
|
|
|
|
1.3
|
Vehicle crash
damage
|
Road closure
and chemical/load spill clean up. Pollution of watercourse
|
Maintenance
contractor has 24 hour call out facility. Establish a pollution emergency
response plan and make ready for implementation
|
Low
|
|
|
|
1.4
|
Inadequate
maintenance
|
Road failure
|
Maintenance
programme implemented
|
Low
|
|
|
|
1.5
|
Inadequate
Traffic Management Plan for high volume roads
|
Reduced
safety leading to increased crash risk
|
Update TMP
guidelines as identified in OFI 8 of Safety Management System
|
Low
|
|
|
|
1.6
|
Inadequate
on-road residential parking
|
Unsafe
parking or installation of no-parking lines leading to public dissatisfaction
|
|
Mod
|
Consider when
designing local road upgrades
|
Low
|
|
2.0
|
Road bridges
(including footbridges and cycleway underpasses)
|
|
2.1
|
Structural
failure due to earthquake
|
Catastrophic
damage to bridge structure. Prolonged road closure
|
Arterial and
Lifeline bridges designed and constructed to earthquake loading standards
|
High
|
Implement
recommendations from seismic strengthening of lifeline bridges
|
Low
|
|
2.2
|
Flooding
greater than bridge capacity
|
Damage to
bridge structure
|
All bridges
constructed to Q50 or Q15 standard (depending on location). Structural
inspections every five years and maintenance inspections annually
|
Low
|
|
|
|
2.3
|
Flooding that
closes cycleway underpasses
|
Inconvenience
to cyclists and pedestrians
|
Suitable
warning signage
|
Low
|
|
|
|
3.0
|
Road
retaining walls
|
|
3.1
|
Structural
failure due to earthquake or landslide
|
Catastrophic
damage to several retaining walls. Road closure
|
Arterial and
lifeline bridges designed and constructed to earthquake loading standards
|
Low
|
|
|
|
3.2
|
Inadequate
design
|
Damage to
retaining wall
|
Design to
comply with Building Control Act requirements
|
Low
|
|
|
|
3.3
|
Inadequate
maintenance
|
Retaining
wall failure
|
Structural
inspections every six years. Worst walls to occur every two years.
|
Low
|
|
|
|
4.0
|
Roading
drainage (sumps, pipework and culverts)
|
|
4.1
|
Inadequate
road drainage
|
Downstream
flooding, pavement damage and increased maintenance costs
|
Upgrade road
drainage where secondary flow paths are inadequate and historically private
property flooding occurs
|
Low
|
|
|
|
4.2
|
Inadequate
design or no kerb, channels and sumps
|
Downstream
flooding, pavement damage increased maintenance costs
|
All road
upgrades include drainage in accordance with Land Development Manual
|
Low
|
|
|
|
4.3
|
Inadequate
maintenance
|
Downstream
flooding, pavement damage, increased maintenance costs, increased risk of
storm water pollution
|
Maintenance
programme implemented
|
Low
|
|
|
|
5.0
|
Streetlights
|
|
5.1
|
Inadequate
streetlights that do not comply with Land Development Manual
|
Non-compliance
with level of service requirement
|
|
Mod
|
Implementation
programme established
|
Low
|
|
5.2
|
Energy
inefficient streetlights
|
Additional
power consumption
|
|
Mod
|
Renewal
programme established using LED
|
Low
|
|
5.3
|
Inadequate
maintenance
|
Streetlights
or streetlight column failure
|
Maintenance
programme implemented
|
Low
|
|
|
|
6.0
|
Traffic
Signals
|
|
6.1
|
Power failure
or damage
|
Lights
inoperable
|
|
Mod
|
Manage as
uncontrolled intersection and install appropriate signs except at critical
asset intersections in peak hour where Police appointed as Pointsmen until
standby generators are installed.
|
Low
|
|
6.2
|
Inadequate
maintenance
|
Lights
inoperable or column failure
|
Maintenance
programme implemented. Where signals are disconnected install temporary
priority give way signs
|
Low
|
|
|
|
7.0
|
Safety
Barriers
|
|
7.1
|
Inadequate
barriers not complying with Land Development Manual
|
Non-compliance
with SMS
|
|
Mod
|
Review safety
barriers and develop upgrade and maintenance programme as identified in OFI
10 of SMS
|
Low
|
9. Performance
Monitoring and Improvement Plan
The
primary focus of this improvement plan is to improve our asset management
practices and process that will assist in achieving the least whole of life cost
in maintaining the transport assets and bring improvements to the services
provided.
|
Priority
Areas
|
Improvement
Action
|
Commentary
|
Timeline
|
Estimated
cost
|
|
Data
collection, analysis and monitoring
|
Improve data
collection methodology of delay and travel time data.
|
Current
sample is very small using the following car method. Potential to improve
sample size by improving survey method.
|
2015
|
Within
existing data collection budget
|
|
Improve data
availability to enable more effective tracking of compliance with Levels of
service.
|
A large
amount of data is currently collected but is difficult to access and relies
on a single person to analyse. Wider availability is essential to ensuring
the data is monitored at least quarterly rather than every 1-3 years as
currently is the case. GIS integration is needed.
|
2015-2016
|
Included in
staff cost budgets
|
|
Improve data
collection and reporting for Nbus punctuality, trips and passenger data.
|
Current data
collected does not allow evaluation of demand at different points along
routes. No punctuality data is collected or reported on with the supplier
expected to self monitor. This is unlikely to be accepted by NZ Transport
Agency as a performance monitoring method in the next contract. Integrated
electronic monitoring system is due in 2016.
|
2016
|
$61,000 in
total over the next three years
|
|
Increase
coverage and frequency of pedestrian and cycle data collection.
|
Currently,
comprehensive cycle and walking data is collected every five years. The
availability and cost of other third party data sets (e.g. Strava) will be
investigated to widen the data set. This will allow closer monitoring of
changes in use of these transport modes.
|
2017
|
Unknown
(Further investigation needed)
|
|
Develop
parking demand model based on meter data.
|
Comprehensive
parking demand data is collected manually every 4-5 years on average. In
order to have a more 'live' data set data the meters can be used to give an
indication of trends. This will still need to be validated using the manually
collected data. This will not be possible should Council choose to remove the
charges for parking.
|
2016
|
Included in
staff cost budgets
|
|
Reduce
reliance on RAMM for strategic asset management other than maintenance and
renewals
|
The current
focus of RAMM is not on what isn't there or where levels of service are
lacking but instead on managing what we already have. Improved in-house GIS
development is needed to allow a higher level of data customisation than is
available through RAMM.
|
2017-2018
|
Included in
staff cost budgets
|
|
Programming
|
Develop
polices to encourage officers to reject/accept potential projects
|
Currently, a
large number of potential projects make it to the network deficiencies lists
that are unlikely to ever be considered any further for investigation or
construction. There will be an increased focus on dealing with these
immediately and informing the party that raised the issue that the particular
project will not be proceeding any further.
|
2015
|
Included in
staff cost budgets
|
|
Investigate
pavement condition testing and analysis regime
|
Current
practice is to be reactive rather than predicting when failures are likely to
occur in road pavement structures. A testing programme to allow
prioritisation prior to failure will be investigated in the next three years
and recommended in the next AMP.
|
2015-2018
|
Included in
staff cost budgets
|
|
Develop
expertise in-house for benefit/cost analysis of pavement maintenance versus
rehabilitation
|
This work is
currently contracted out. Council holds all of the available data. Performing
this work in-house will allow a higher level of flexibility in when and how
often it is used in evaluating the value for money of maintenance works.
|
2018
|
Included in
staff cost budgets
|
|
Asset
Strategies
|
Develop
strategy for planning for sea level rise
|
Sea level
rise is expected to result in inundation of the current level of the key
coastal arterials around 2050. Early planning is necessary to understand
impacts.
|
2017-2018
|
Included in
staff cost budgets
|
|
Redefine
Nelson road hierarchy to align with NZ Transport Agency One Network Road
Classification
|
NZ Transport
Agency have finalised the One Network Road Classification (ONRC) that they
are expecting RCAs to implement in the next 1-2 years. This classification
will directly influence the levels of funding that NCC receive from NZ
Transport Agency.
|
2015-2016
|
$50,000
|
|
Develop
Council Policy
|
Private
Access on Road Reserve;
Land slips on
and above Road Reserves;
Speed
complaints procedure;
Speed Hump
Policy;
Signage
Policy;
Power and
Telecom Undergrounding;
Road Reserve
maintenance limitations;
Fatal
Accident Site Marking;
Resident
Parking Zones.
|
2018
|
Included in
staff cost budgets
|
Appendix A Relevant
transport legislation
The
overall framework for planning, funding and managing the land transport system includes
the following Acts, Regulations and Rules. Bills and Rules under development
have been provided as they are likely to become legislation in the short term:
Resource
Management Amendment Act (2003)
· Local Government Act 1974, Local Government Act 2002;
· Land Transport Act 1998, Land Transport Management Act
2003, Land Transport Management Amendment Act 2008, Land Transport Management
Amendment Act 2013, Land Transport (Enforcement Powers) Amendment Act 2009, Land Transport Amendment Act 2009, Land Transport (Road Safety and
other matters) Amendments Act 2011, Land Transport (Road Safety and other
Matters) Amendment Act 2011, Government Roading powers Act 1989;
· Resource Management Act 1991, Resource Management
(simplifying and streamlining) Amendment Act 2009, Resource Management
Amendment Act 2013, Building Act 2004, Building Amendment Act 2012, Building
Amendment Act 2013, Health Act 1956;
· Requirements of the Auditor General (refer Appendix J
for improvement measures specific to the Transport Activity).
Bills
· Local Government Act 2002 Amendment Bill (No.3).
Regulations
· Heavy Motor Vehicle Regulations 1974;
· Land Transport (Infringement and Reminder Notices)
Regulations 1998 and 2012, Land Transport (Offences and Penalties) Regulations
1999, Land Transport (Ordering a Vehicle off the Road) Notice 1999 Land
Transport (Requirements for Storage and Towage of Impounded Vehicles)
Regulations 1999;
· Land Transport (Storage and Towage fees for Impounded
Vehicles) Regulations 1999, Transport Services Licensing Regulations 1989,
Traffic Regulations 1976.
All
Land Transport Rules, including
· Operator Licensing 2007, Passenger Service Vehicles
1999, Road User Rule 2004, Setting of Speed Limits 2003, Traffic Control Devices 2004, Vehicle Dimensions and
Mass 2002, Vehicle Lighting, Driver Licensing.
Bylaws
· Parking and Vehicle Control Bylaw 207 (2011) and 2012
Amendment;
· Speed Limits Bylaw 210 (2011) and associated Amendment
1 (2013).
Appendix B Nelson’s
Strategies and Policies
NELSON CITY COUNCIL LONG TERM
PLAN
The
last Long Term Council Community Plan was adopted in July 2012. It is a
requirement of the Local Government Act 2002 to have such a plan to manage the
Council’s activities and budgeting. Details in the plan forms the basis
for the Council’s annual planning process. The plan must have a focus on
social, cultural, economic and environmental outcomes. The next LTP 2015 -2025
will be adopted by Council in June 2015.
NELSON REGIONAL POLICY
STATEMENT 1997
This
document is at the top of the hierarchy of resource management considerations.
It is prepared under the Resource Management Act and has statutory force.
Its
purpose is to identify regional issues in terms of natural and physical
resources and to outline objectives, policies and methods to achieve integrated
management of the natural and physical resources of the whole region, including
cross-boundary issues with other regions.
Other
plans prepared under the Resource Management Act must now “give
effect” to the provisions of the relevant regional policy statement for a
region or district (changes to the Resource Management Act in 2005 have
increased the importance of the Regional Policy Statement).
Nelson’s
Regional Policy Statement was made operative in 1997.
Amongst
the regional cross-boundary issues identified are:
· “consistent management of transport nodes
(including the port and airport), their adverse effects and equality of access
(Nelson City/Tasman District)”; and
· “a consistent approach to roading (Marlborough
District/Nelson City/Tasman District).”
Key
Chapters of the Regional Policy Statement in relation to the arterial study are
Chapter 8, The Coast; and Chapter 14, Infrastructure. In general terms, Chapter
6, Development and Hazards, anticipates an increasingly compact urban form for
the city, for efficiency reasons but also to protect and retain the rural
setting of the city and to avoid natural hazards which are perceived as
significant in areas adjacent to urban areas in the future (including climate
change and sea level rise).
NELSON RESOURCE MANAGEMENT
PLAN
This
document is an integrated district and regional plan for the management of all
the region’s natural and physical resources under the Resource Management
Act (with the exception of air quality, for which there is a separate regional
plan). The Plan was made operative in 2004 and has full statutory weight.
While
much of the Plan and its policy framework is organised to apply to individual
zones (e.g. residential, commercial, industrial) there is a set of District
wide objectives and policies which apply across the whole region. Amongst them
is a significant section on land transport, DO10.
REGIONAL LAND TRANSPORT PLAN
2015-2025
RLTPs
are six-year documents with a ten year horizon that provide strategic context
and direction for each regional programme. Key considerations include:
· developing a significance policy to prioritise
significant activities;
· developing the front end strategic case using business
case approach principles;
· having a programme of activities, not just projects,
with clear linkages between all activities and agreed outcomes, e.g.
relationship between investing in different modes and activities funded outside
the National Land Transport Fund;
· setting out land transport objectives, policies and
measures for at least 10 financial years;
· considering the infrastructure implications and/or
public transport service improvements that are needed to support growth areas;
· considering the feasibility and affordability of
alternative regional land transport objectives;
· identifying performance measures that will be used to
monitor activities.
The
Regional Land Transport Plan is under development at the time of writing this
Asset Management Plan. It will be adopted by Council in April 2015.
REGIONAL PUBLIC TRANSPORT
PLAN 2015
The
purpose of the regional public transport plan is to provide:
· A means for encouraging councils and operators to work
together in developing public transport services and infrastructure.
· An instrument for engaging with the public in the
region on the design and operation of the public transport network.
· A statement of:
o The public transport services that are integral to the public
transport network.
o The policies and procedures that apply to those services.
o The information and infrastructure that supports those
services.
The Regional Public Transport Plan is under
development at the time of writing this Asset Management Plan. It will be
adopted by 30 April 2015.
ARTERIAL TRAFFIC STUDY 2011
The
Arterial Traffic Study was a key initiative in order to achieve the Community Outcomes
2009/19 Nelson Community Plan.
The
objective of the Arterial Traffic Study was to determine the best transport
system configuration between Annesbrook and the Queen Elizabeth II/Haven Road
roundabouts that will improve the city as a whole in the long term. Refer to
section 2.1 for more details on the outcomes of the study.
SOCIAL WELLBEING POLICY 2010
The
Counci’s vision for this policy is that Nelson has a happy, healthy
community where people have access to necessary services and facilities and feel
connected to each other and to the city.
Council
will ensure that social wellbeing issues are considered when planning and
delivering new services, facilities and activities.
Areas
where Council has a key responsibility or role include the physical environment,
leisure and recreation, social connectedness, cultural identity, civil and
political rights and safety (particularly relating to safety in public spaces).
With limited resources available Council needs to focus on areas where it can
have a significant impact and rely on partners to take the lead in other areas.
Council
has chosen to focus on particular issues surrounding older people, youth and
affordable housing in this policy. These three areas relate to key trends
affecting Nelson and have been raised as particular concerns by the community.
Over
and above initiatives that directly aim to improve social wellbeing, most
Council activities (such as economic development, transport, water supply,
waste collection, environmental planning, parks and community facilities)
impact on the wellbeing of the community.
Council’s
social wellbeing role includes:
· Leading by example - looking at Council activities
through a social wellbeing “lens” to improve social wellbeing
outcomes for the community;
· Partnering, collaborating and
facilitating –
with central government, community organisations and other stakeholders to
target initiatives effectively;
· Delivery – of services and activities
(including through grants to community groups) within wellbeing areas where
Council has responsibility;
· Advocacy – at regional and national
levels;
· Planning – ensuring that the
development of facilities and services contributes to enhancing wellbeing in
the future.
PEDESTRIAN STRATEGY (2005)
AND CYCLING STRATEGY (2006)
These
two strategies are well-developed documents, which link back to the Regional
Policy Statement for statutory policy and to the LTP for community outcomes and
a budget. They are complementary to the Regional Transport Plan.
HEART OF NELSON –
CENTRAL CITY STRATEGY
This
was a special study, carried out in 2009, focused at the Council’s
interest in achieving various community outcomes in the LTP. The Mayor’s
Foreword states that the Council “wants to maintain a vibrant and vital
heart of the city” for locals and visitors, and to encourage economic
development. It is intended “to manage growth in a coordinated manner and
to maintain and enhance the successfulness of the City Centre and surrounding
area”.
The
Strategy consists of an overall vision supported by numerous specific
suggestions and proposals to enhance the function, usability and vitality of
the city centre over time.
TAHUNANUI STRUCTURE PLAN
This
structure plan is dated 2004 and had its genesis in the Tahunanui Enhancement
Study 2002, which looked at improvements needed in the City’s popular
beach recreational area arising from expressed concerns about the
“existing condition of Tahunanui”.
The
achievement of the Structure Plan relies primarily on public expenditure to
achieve street layout and access changes, and changes to the Nelson Resource
Management Plan to enable intensification and cohesion around the traditional
commercial heart of Tahunanui. The structure plan has no statutory force.
OTHER KEY PLANS & STRATEGIES RELATING TO
TRANSPORT
· Nelson Urban Growth Strategy 2005
o Road Reserve Management Policies and Procedures (pending)
Objective is to provide for a consistent approach to road reserve asset and
activity management and to demonstrate to the community that Council recognises
the critical importance of managing the road reserve asset and activities in an
effective and sustainable manner;
o Council will manage the city’s assets and activities on
the road reserve in a cost effective, sustainable, well planned and coordinated
manner to provide agreed levels of service. Council will use the various
policies and procedures referenced in Road Reserve Management Policy as the
means to fulfil its ownership responsibilities under the Local Government Act
2002.
· Land Development Manual 2010;
· Safety Management Strategy 2007;
· Road Safety Action Plan.
Appendix C Strategic
documents, studies and models providing demand data
|
Demand Driver
|
Document Name
|
Date
|
Source reference
|
Notes
|
|
Sustainability
|
Sustainability
Stock take
|
April
2011
|
A293617
|
|
|
Population
|
Population
projections
|
2015
|
A1322277
|
|
|
All
|
Arterial
Traffic Study
|
2010-2011
|
A371678
- Stage 1
A362768
- Stage 1B
A431870
– Stage 3
A618888
- Stage 4
|
Includes
consideration of fuel price rises, sea level rises etc.
|
|
Update
on several key demand drivers
|
Regional
Land Transport Strategy & Regional Land Transport Programme Annual
Monitoring report
|
September
2010
November
2013
|
A378027
A478601
|
Includes
journey to work, main means of travel, traffic volume, travel times on
arterials, vkt’s, cycle and ped counts, comprehensive cycle count data,
pt patronage, safety data.
|
|
Traffic
growth
|
Nelson
Tasman Transport Model TRACKS model building report
|
2009-2010
|
A673715-model
building report
1089224-model
data
945050,945051-turning
movement data
945048-level
of service
|
Includes
data on future transport demands.
|
|
Population,
demographic, household car ownership, journey to work, freight, air
connections and employment data
|
Regional
Land Transport Strategy
|
June
2009
|
RAD
696474
|
Also
provides future travel demand and future journey to work predictions, along
with Council’s long term passenger transport aspirations.
|
|
Central
City strategic direction
|
Heart
of Nelson Strategy
|
Aug
2009
|
RAD
845339
|
|
|
Population,
freight, car parking, future land use and residential growth areas
|
TRACKS
models input data
|
May
2009
|
781450
813236
|
|
|
Traffic
flow along Waimea Road
|
Waimea
Rd Microscopic Traffic Simulation Model
|
July
2009
|
798279,
798280, 813239, 797883
|
Includes
various intersection scenarios.
|
|
Car
Parking
|
2009
Central Business District Parking assessments and district ratio analysis
|
2009
|
800221,
800227, 800228
|
|
|
Sea-level
rise
|
Review
of Nelson City minimum ground level requirements in relation to coastal
inundation and sea level rise
|
August
2009
|
RAD
825295
|
|
|
Population
and employment growth to 2016, journey to work patterns and discussion of
travel patterns
|
Passenger
Transport Network Review
|
October
2008
|
RAD
701862
|
|
|
Traffic
flow
|
Signalised
intersection design data
|
|
796898
|
|
|
Road
safety data
|
Crash
Accident Study
|
1995
1998
2001
2008
|
799187
342066
799203
742399
|
|
|
Car
Parking
|
Parking
Studies
|
2005
2008
|
682309
788326
|
|
|
Traffic
flow and parking data
|
Nelson
Central Business District Microscopic Traffic Simulation Model
|
2012
5/2005
|
A789874
789948
|
|
Appendix D Growth
indicators
Congestion
–Traffic Flow Data on the Main Arterials – ATS
Peak
hour traffic count information has been obtained for three locations on the arterial
routes and are summarised below. The data was obtained during February 2014.
Table D.1 Peak
Hour Volumes
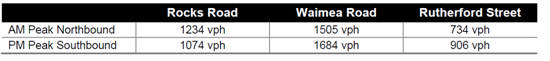
Car
Trips –Traffic Flow Data on the Main Arterials
The
following graph shows the 7-day average daily traffic volumes for selected
roads over time.
Figure D.1 Nelson Arterial Traffic Volumes
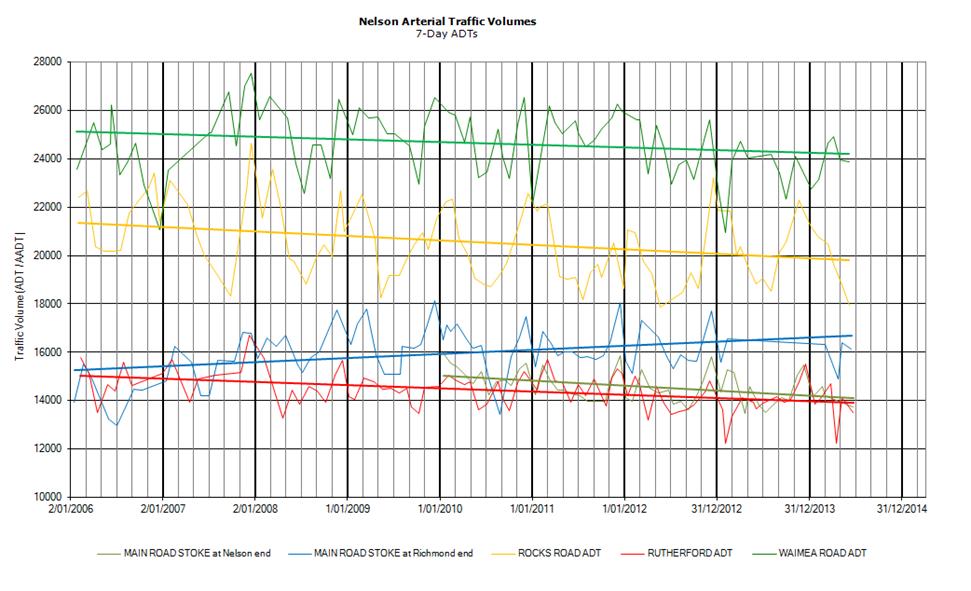
The
following graphs show the peak hour traffic volumes on the arterial routes by direction.
The data has been presented from 2009 to the latest data available for 2014.
This data range is for the period that the current traffic counting contractor
has been working for Nelson City Council. Data prior to this does not contain
enough detail to present graphs such as those following and as a result it has
been excluded.
Figure D.2 Waimea-AM
Peak Hour Ending 0900
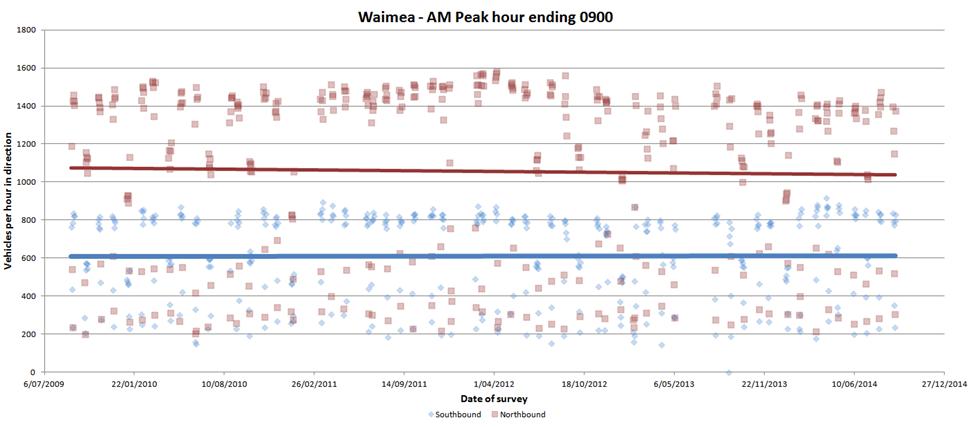
Traffic
volumes on Waimea Road in the AM peak hour have been reducing slightly in the
northbound direction and have remained static in the southbound direction.
Figure D.3 Waimea
– Peak Hour Ending 1700
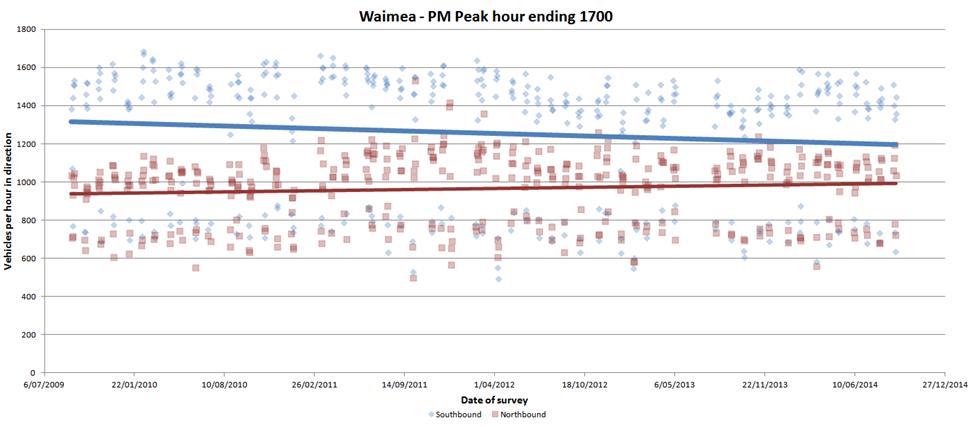
Traffic
volumes on Waimea Road in the PM peak hour have been reducing in the southbound
direction and increasing in the northbound direction.
Figure D.4 Waimea
– Midday Peak Hour Ending 1300
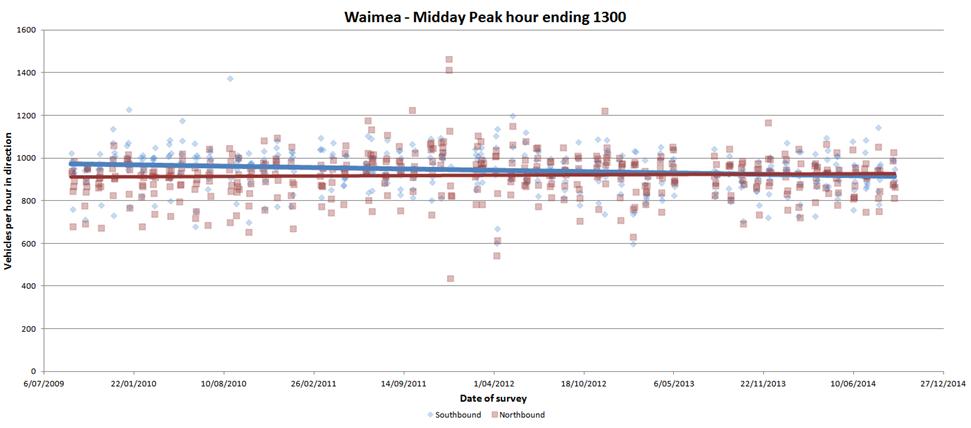
Traffic
volumes on Waimea Road in the midday peak hour have been reducing in the
southbound direction and have remained static in the northbound direction.
Figure D.5 Waimea
– Weekday AM Peak Hour Ending 0900
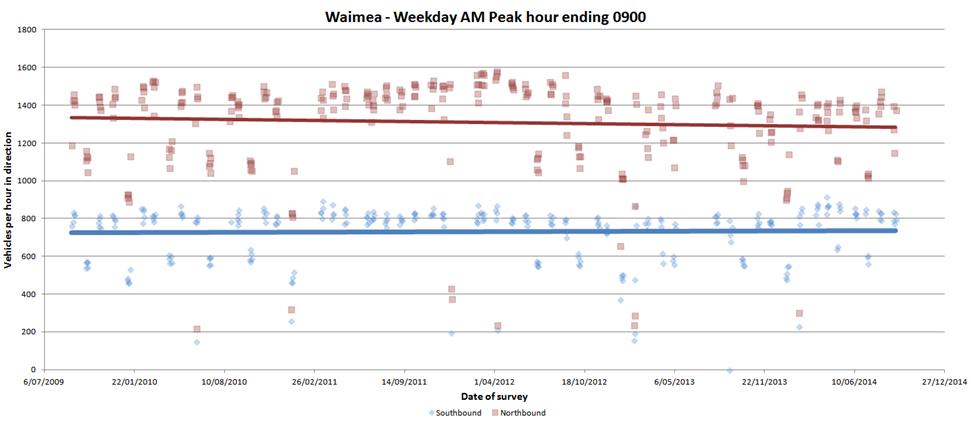
Traffic
volumes on Waimea Road, with weekend data removed, in the AM peak hour have
been remained static in the southbound direction and have decreased in the
northbound direction.
Figure D.6 Waimea
– Weekday PM Peak Hour Ending 1700
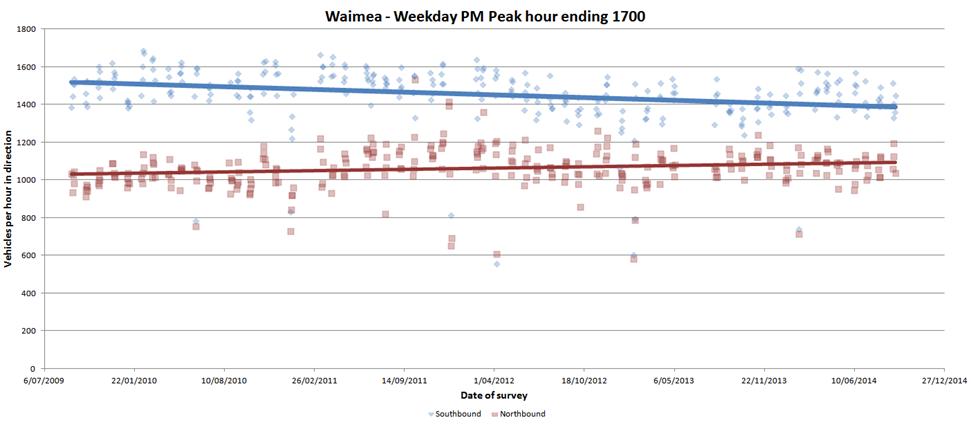
Traffic
volumes on Waimea Road, with weekend data removed, in the PM peak hour have
reduced in the southbound direction and have increased in the northbound
direction.
Figure D.7 Waimea
– Weekday Midday Peak Hour Ending 1300
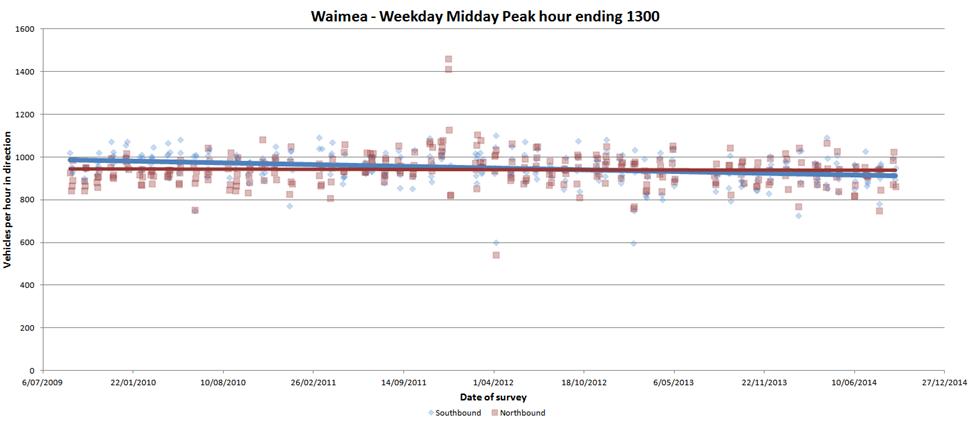
Traffic
volumes on Waimea Road, with weekend data removed, in the midday peak hour have
been reducing in the southbound direction and have remained static in the
northbound direction.
Figure D.8 Rocks
Road -AM Peak Hour Ending 0900
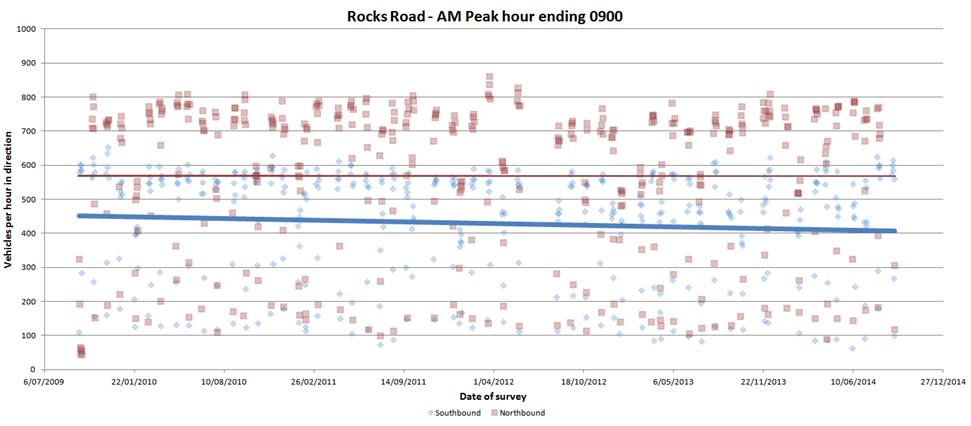
Traffic
volumes on Rocks Road in the AM peak hour have remained static in the northbound
direction and have reduced in the southbound direction.
Figure D.9 Rocks
Road– PM Peak Hour Ending 1700
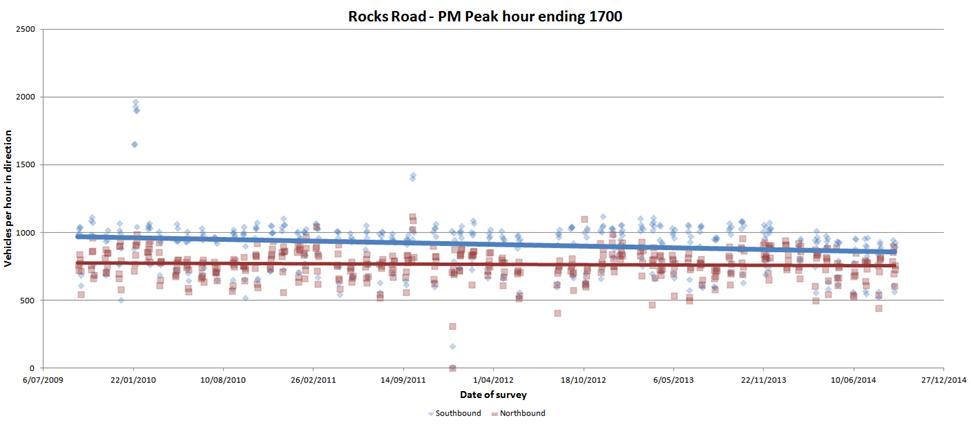
Traffic
volumes on Rocks Road in the PM peak hour have remained static in the
northbound direction and have reduced in the southbound direction.
Figure D.10 Rocks Road–
Midday Peak Hour Ending 1300
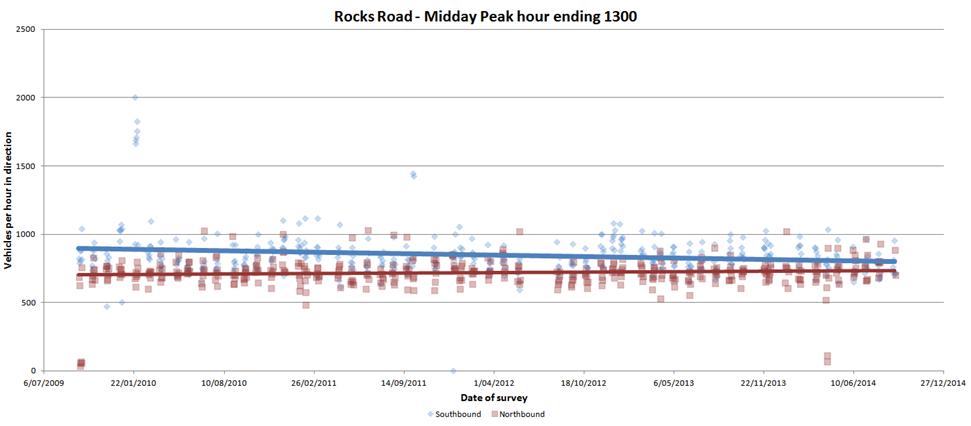
Traffic
volumes on Rocks Road in the midday peak hour have remained static in the
northbound direction and have reduced in the southbound direction.
Figure D.11 Rocks Road –
Weekday AM Peak Hour Ending 0900
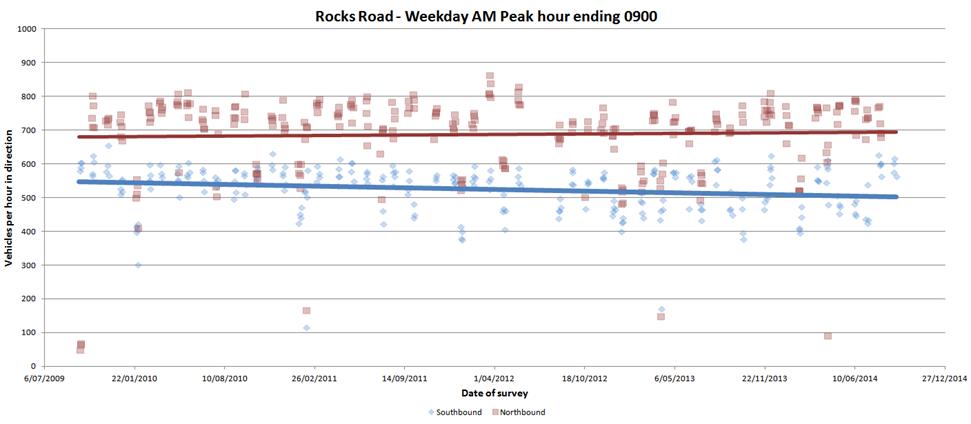
Traffic
volumes on Rocks Road in the AM peak hour, with weekend data removed, have
increased in the northbound direction and have reduced in the southbound
direction.
Figure D.12 Rocks Road–
Weekday PM Peak Hour Ending 1700
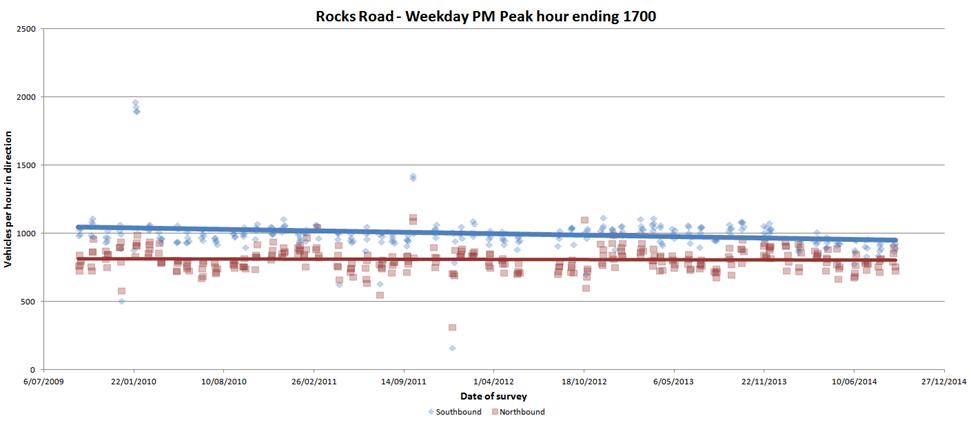
Traffic
volumes on Rocks Road in the PM peak hour, with weekend data removed, have
remained static in the northbound direction and have reduced in the southbound
direction.
Figure D.13 Rocks Road –
Weekday Midday Peak Hour Ending 1300
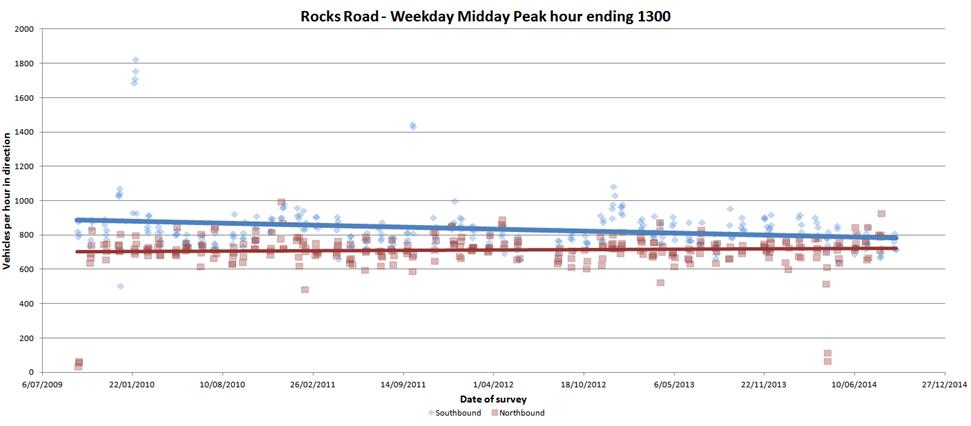
Traffic
volumes on Rocks Road in the weekday peak hour, with weekend data removed, have
increased slightly in the northbound direction and have reduced in the
southbound direction.
Figure D.14 Main Road Stoke
–AM Peak Hour Ending 0900
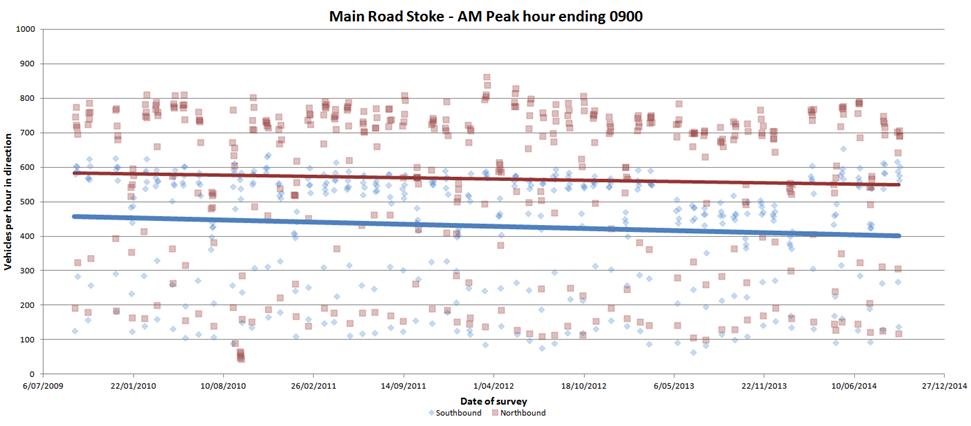
Traffic
volumes on Main Road Stoke in the AM peak hour have reduced in both the
northbound and southbound directions.
Figure D.15 Main Road Stoke
– PM Peak Hour Ending 1700

Traffic
volumes on Main Road Stoke in the PM peak hour have remained static in the
northbound direction and reduced in the southbound direction.
Figure D.16 Main Road Stoke
– Midday Peak Hour Ending 1300
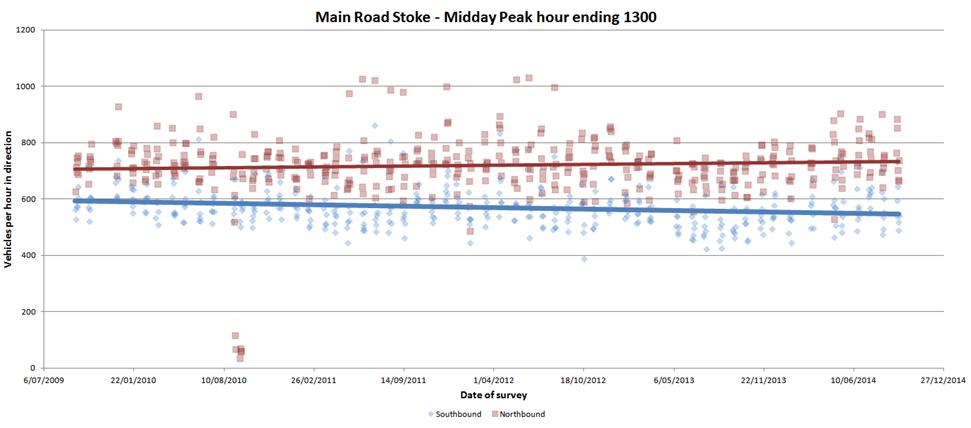
Traffic
volumes on Main Road Stoke in the PM peak hour have increased in the northbound
direction and reduced in the southbound direction.
Figure D.17 Main Road Stoke
– Weekday AM Peak Hour Ending 0900
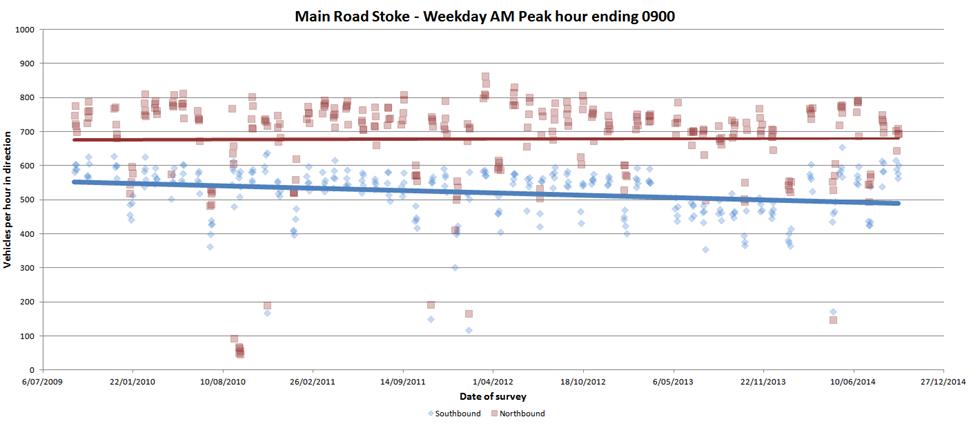
Traffic
volumes on Main Road Stoke in the AM peak hour, with weekend data removed, have
remained static in the northbound direction and reduced in the southbound
direction.
Figure D.18 Main Road Stoke
– Weekday PM Peak Hour Ending 1700
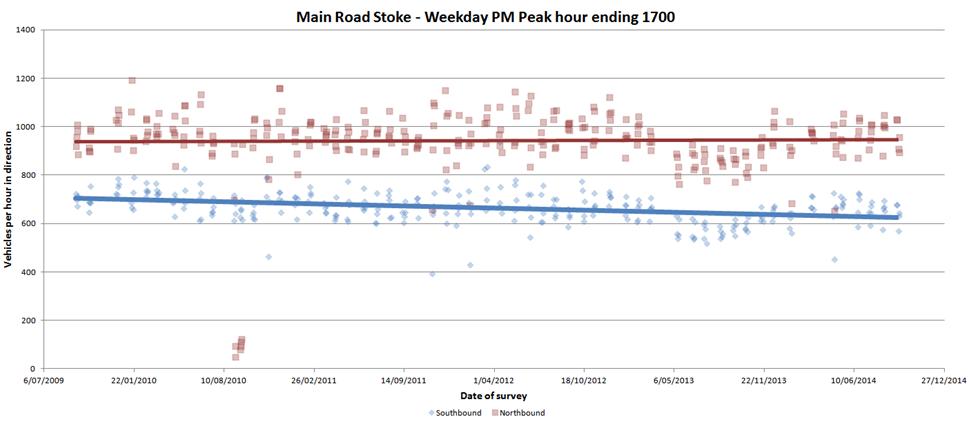
Traffic
volumes on Main Road Stoke in the PM peak hour, with weekend data removed, have
remained static in the northbound direction and reduced in the southbound
direction.
Figure D.19 Main Road
Stoke– Weekday Midday Peak Hour Ending 1300
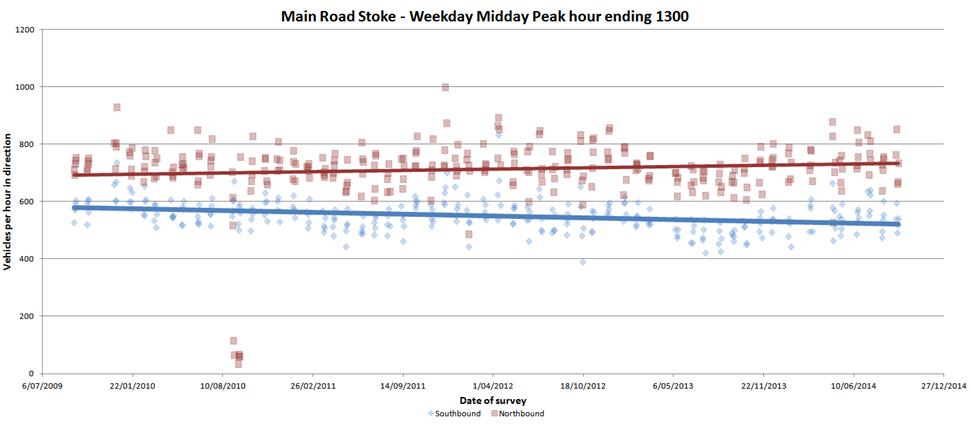
Traffic
volumes on Main Road Stoke in the midday peak hour, with weekend data removed,
have increased in the northbound direction and reduced in the southbound
direction.
The
following graphs show the total traffic using Waimea Road and Rocks Road. Note
that these are composite peak hour volumes due to the surveys for both
arterials being done at different times. The numbers presented show the totals
for each weekday per month surveyed but are offset by up to three weeks.
Figure D.20 Waimea –
Rocks Road - AM Peak Hour Ending 0900 - Screenline
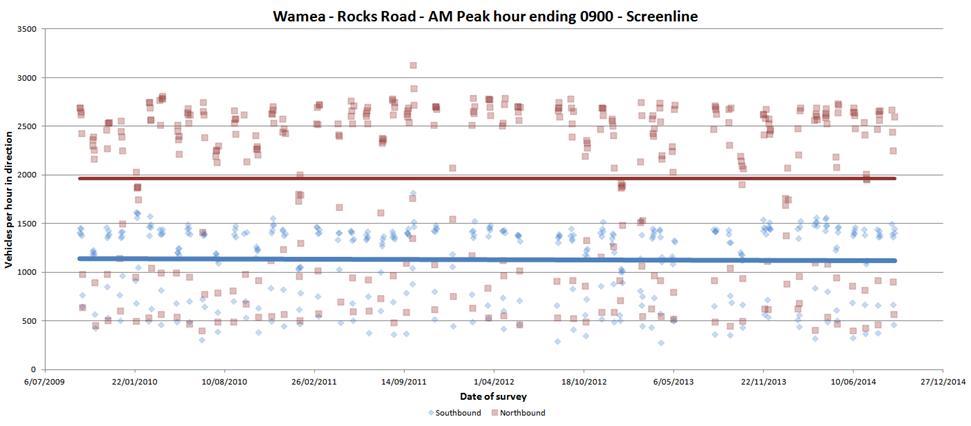
The
AM peak has remained essentially static from 2009 to date. The weekend data is
included in this graph and is shown by the band of data points well below the
main concentration of data associated with the weekdays.
Figure D.21 Waimea –
Rocks Road - PM Peak Hour Ending 1700 - Screenline
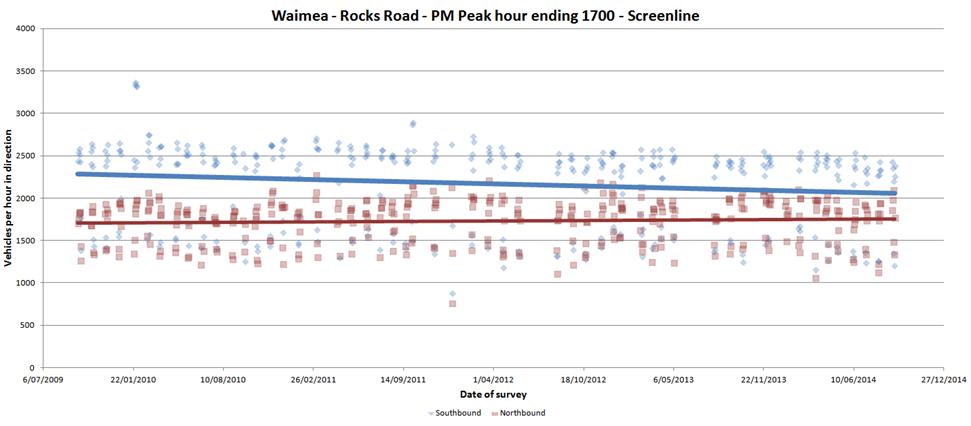
The
PM peak data does not show the same range as the AM data with weekends
operating at a level much closer to the main weekday data set. The traffic in
the northbound direction has remained essentially static. Southbound PM peak
flows have trended downwards over the period presented above.
Figure D.22 Waimea –
Rocks Road - Midday Peak Hour Ending 1300 - Screenline
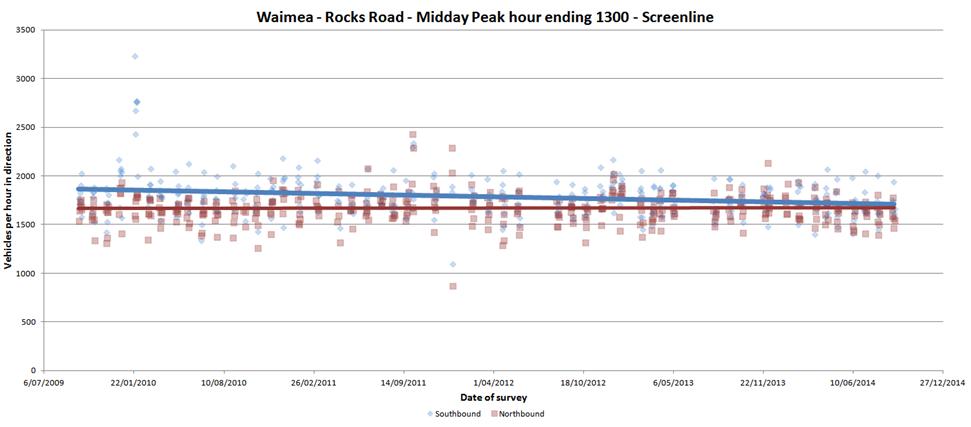
Data
for the midday peak show that northbound traffic has remained static and
southbound traffic has deceased.
Figure D.23 Waimea –
Rocks Road – Weekday AM Peak Hour Ending 0900 - Screenline
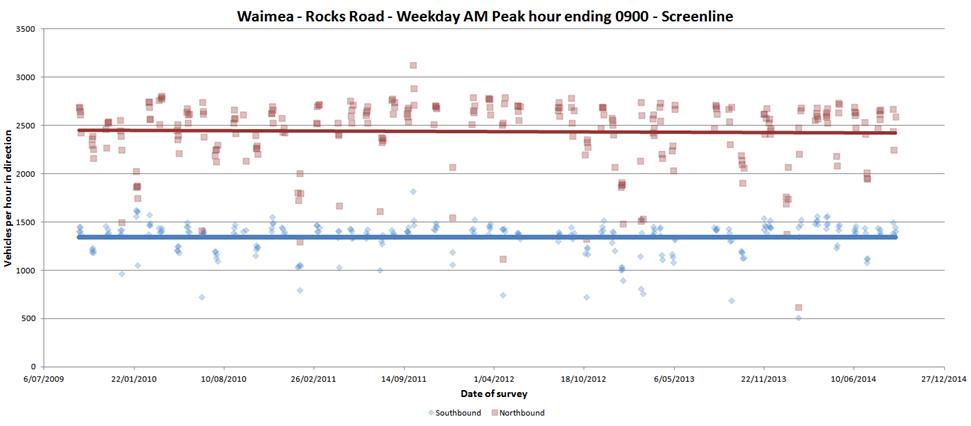
When
the weekend data is removed the trend does not change with traffic volumes in
the AM peak remaining essentially static from 2009 to date but with a very
slight reduction in northbound traffic.
Figure D.24 Waimea –
Rocks Road – Weekday PM Peak Hour Ending 1700 - Screenline
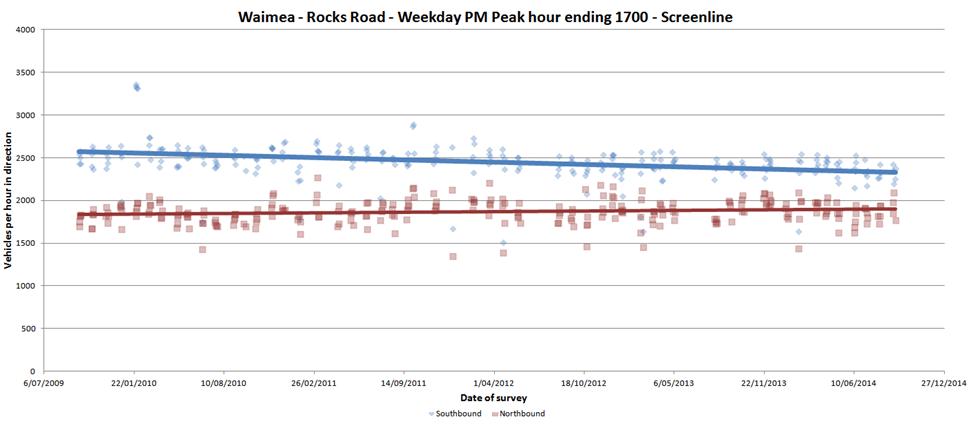
Once
the weekend data is removed the northbound PM peak traffic shows a slight
increase. The decreasing trend in the southbound traffic volumes remains.
Figure D.25 Waimea –
Rocks Road – Weekday Midday Peak Hour Ending 1300 - Screenline
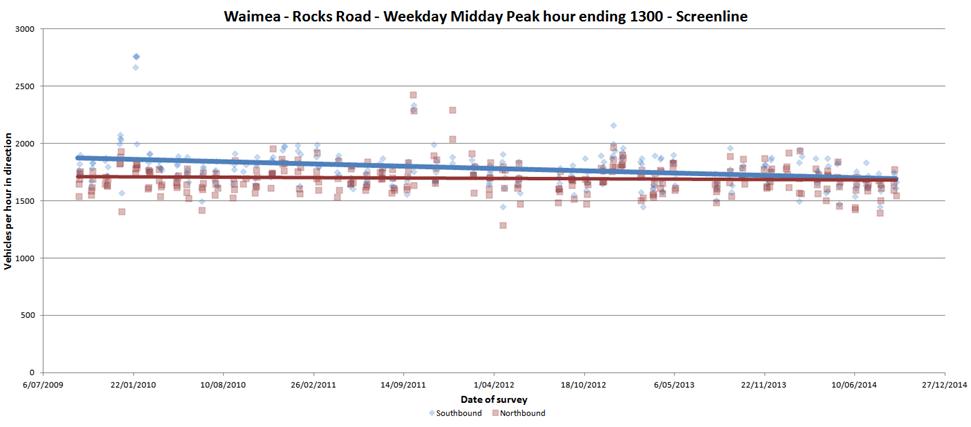
The
trends in the midday peak remain unchanged by removal of the weekend data. The
southbound traffic volumes have been decreasing and the northbound volumes
remaining static.
Walking
–Historic Pedestrian Counts
The
following graphs show the time series data for pedestrian counts extrapolated
out to 24 hours. Counts were started in 2001 and counted regularly every 6
months from 2005 onwards. Two additional sites were added in 2010, the Whakatu
Drive and Atawhai Drive shared paths. The seasonal difference in number of
pedestrians is clearly visible.
Figure D.26 Pedestrian Counts
Figure D.27 Pedestrian
– 7 hr Count Total
Figure D.28 2010 Comprehensive Cyclist and Pedestrian
Count
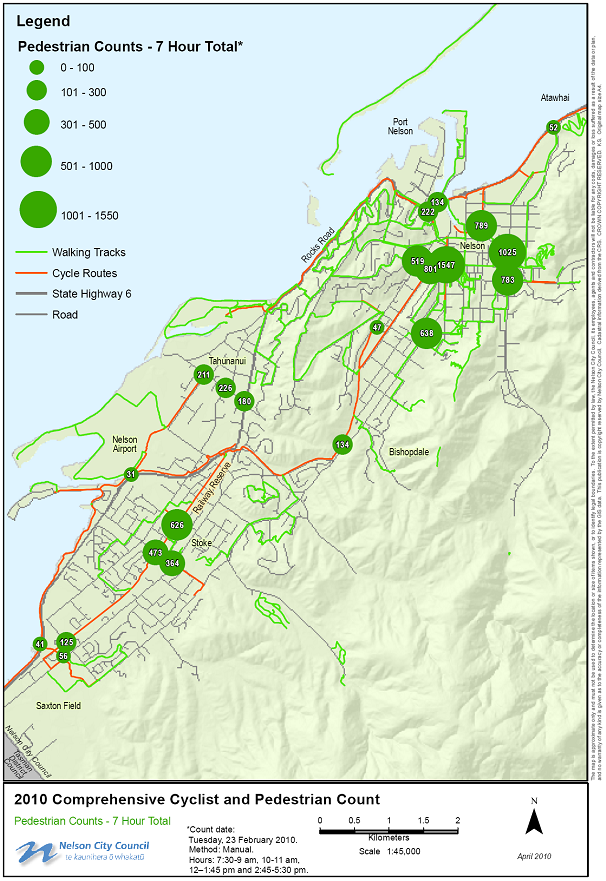
Note: These surveys are to be repeated at five yearly
intervals with the next due in 2015.
Cycling
–Historic Pedestrian Counts (Regional Land Transport Strategy Annual
Report)
The
following graphs show the actual number of cyclists counted over a 7 hour
period. Counts are taken at the same sites and times as the pedestrian counts.
Figure D.29 Cyclists – 24
hrs Estimates
Figure D.30 Cyclists
– 24 hrs Estimates (All Routes Above)
Figure D.31 2010 Comprehensive Cyclist and Pedestrian
Count
Note: These surveys are to be repeated at five yearly
intervals with the next due in 2015.
Nelson Projections
Table D.2 Population
projections, 2015-2045
Figure D.33 Nelson
- Projected population, 2015-2045
· Population and
household numbers increasing but at a slower rate;
· Ageing population;
· Smaller households;
· Growth in Stoke.
Nelson
– population trends
· Nelson’s
population is expected to grow by 3,600 residents over the next ten years, to
53,320 in 2025, at an average annual growth rate of 0.7 percent
· Half the growth
between 2015 and 2025 is driven by an increase in Stoke’s population and
the populations in Nelson Central, Nelson North and Tahuna are also expected to
increase
· Population growth is
expected to slow down over time, based on the assumption that deaths will
increase while births stay constant, and that migration rates also remain
constant
· Nelson’s
population is likely to grow by a further 2,700 over the 20 years between 2025
and 2045, to 56,000 in 2045, at an average annual growth rate of 0.2 percent
· Most of the growth in
these later years is again driven by an increasing population in Stoke and, to
a lesser extent, in Nelson North
· Nelson’s
population is ageing and the median age is projected to increase from 43 in
2015 to 50 in 2045
· The proportion of the
population aged 65 years and over will increase from 18% in 2015 to 25% in 2025
and is likely to make up a third of the population in 2045
· The proportion of the
population aged under 15 years will decrease after 2018, from 18% to 16% in
2025 and to 15% by 2045
Figure D.34: Population
projections by age groups, Nelson
Nelson
– households TRends
· The number of
households in Nelson is projected to increase by about 1,800 in the ten years
between 2015 and 2025, to 22,310
· As with the
population growth, about half the increase between 2015 and 2025 in the number
of households is driven by growth in Stoke and a quarter is by Nelson Central
· The number of
households in Nelson is projected to increase by another 1,800 in the twenty
years between 2025 and 2045, to 24,150, with over half of the increase driven
by an increasing number of households in Stoke
· Overall there is a
trend towards smaller households with an increase in one-person households
Method
· Annual population
projections which align with Nelson City Council Long Term Plan and
Infrastructure Strategy reference years (2015-2025-2045) have been calculated
using linear interpolation. Annual household projections have been calculated
using ratios between population and households suggested by Rationale Ltd in
their 2014 peer review and confirmed in February 2015 as
still being valid. These numbers are indicative until Statistics New Zealand
release 2013-based household projections on 8 December 2015. Projections for
different areas within Nelson (Stoke, Tahuna, Central and North) are based on
2013-based area unit projections which were published on 9 July 2015.
· Projections are not predictions and
should be used as an indication of the overall trend, rather than as exact
forecasts.
Appendix E How
the focus areas link with the government’s, NZ Transport Agency’s
and Council’ s strategic documents
Focus
Area Safety
Government’s
long-term outcomes:
· To drive improved performance from the land transport
system by focussing on:
o Economic growth and productivity;
o Road safety;
o Value for money.
Government’s
Forward Plan for Transport:
· Implement the Safer Journeys road safety strategy and
its Safe System approach, so there is a sustained reduction in deaths and
serious injuries on the roads over time.
Government
Policy Statement 2015 objective:
· Free of death and serious injury.
Regional
Land Transport Plan:
· Aligns with GPS.
Nelson
Community Plan outcomes:
· People-friendly places - We build healthy, accessible
and attractive places and live in a sustainable region;
· Kind, Healthy People – We are part of a
welcoming, safe, inclusive and healthy community.
Nelson
City Council Pedestrian Strategy goals:
· Provide a safe network;
· Provide a user friendly network.
Nelson
City Council Cycling Strategy outcomes:
· A culture that acknowledges cycling as a part of
everyday life, where people support cycling and see it as a safe transport
choice;
· A safe, convenient and continuous cycle route network
linking all parts of the City, incorporating best practice design and
engineering standards.
Focus
Areas: Local Roads, Walking, Cycling and Schools, and Public Transport
Draft Government Policy Statement 2015 objective:
· A land transport system that provides appropriate
transport choices.
Government
Policy Statement 2015 long term result:
· Improved returns on investment in public transport.
· Enable access to social and economic opportunities,
particularly for people with limited access to a private vehicle.
· Increased safe cycling through improvement of the
cycle lane network.
Regional
Land Transport Plan:
· Aligns with GPS.
Nelson
Community Plan outcomes:
· Healthy land, sea, air and water – We protect
the environment;
· People-friendly places – We build healthy,
accessible and attractive places and live in a sustainable region;
· A strong economy – We all benefit from a
sustainable, innovative and diversified economy;
· Kind, Healthy People – We are part of a
welcoming, safe, inclusive and healthy community.
Nelson
City Council Pedestrian Strategy goals:
· Develop a linked network;
· Recognise walking as an important physical activity.
· The LTP included an
action to develop an active transport and active recreation policy which will
supersede the pedestrian strategy in 2015.
Nelson City Council Cycling Strategy
outcomes:
· A culture that acknowledges cycling as a part of
everyday life, where people support cycling and see it as a safe transport
choice.
· The LTP included an
action to develop an active transport and active recreation policy which will
supersede the pedestrian strategy in 2015.
Focus
Areas: Arterial Traffic, Parking and Value for Money Principle
Draft Government
Policy Statement 2015 Objective:
· A land transport system that is reliable and
resilient.
· A land transport system that addresses current and
future demand.
· A land transport system that provides appropriate
transport choices.
· A land transport system that appropriately mitigates
the effects of land transport on the environment.
Government
Policy Statement 2015 long term result:
· Support economic growth and productivity through
provision of better access to markets, employment and business areas;
· Improved returns from investment in road maintenance;
· Support economic growth of regional New Zealand
through providing better access to markets;
· Improved network resilience and reliability at the
most critical points;
· Understand the costs associated with environmental
mitigation.
Regional
Land Transport Plan:
· Aligns with GPS.
Nelson
Community Plan outcomes:
· People-friendly places – We build healthy,
accessible and attractive places and live in a sustainable region;
· Kind, Healthy People – We are part of a
welcoming, safe, inclusive and healthy community.
Appendix F Definition
of Levels of Service
Table F.1 Definition
of Levels of Service
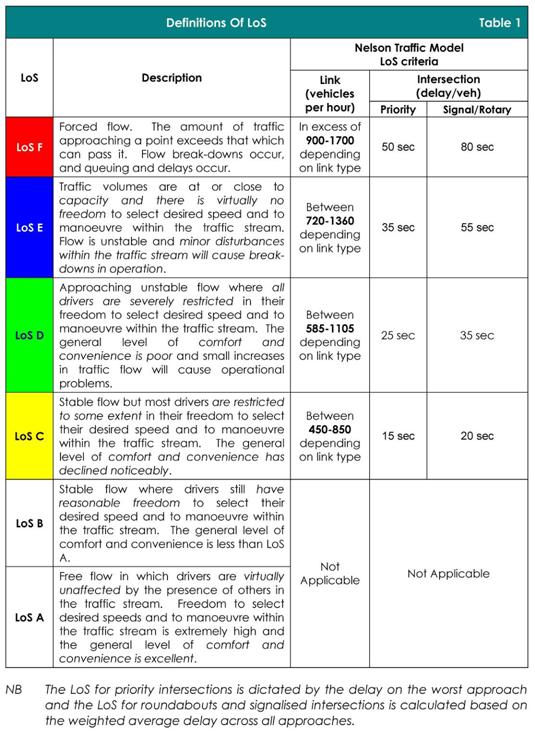
Figure F.1 Nelson-Tasman Transportation
Model Link LoS Criteria
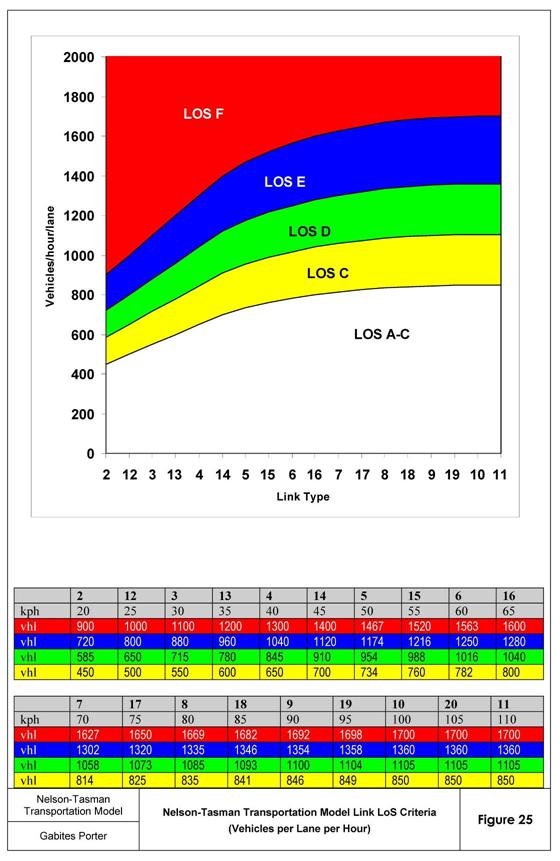
Table F.2 Nelson Arterial
Traffic Study Network Performance Summary Statistics
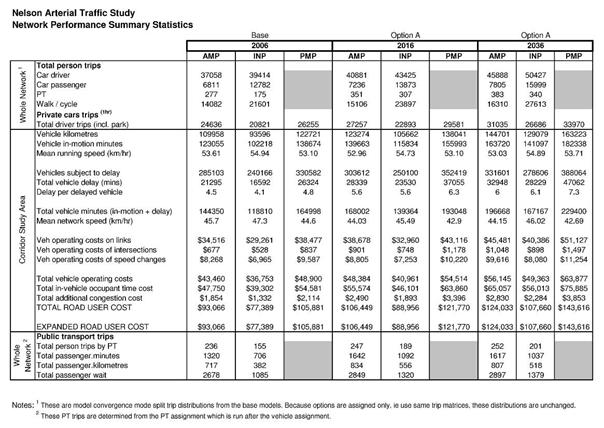
Table F.3 Nelson
Arterial Traffic Study Network Performance Summary Statistics
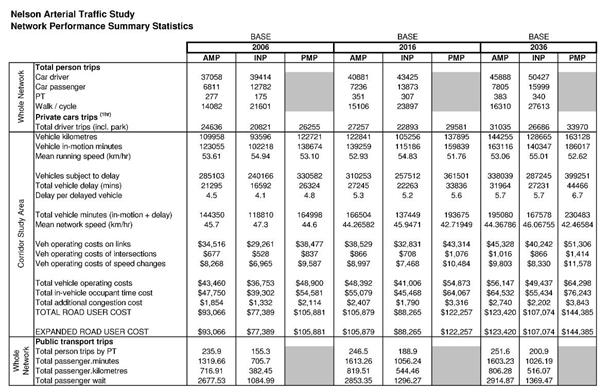
APPENDIX G STREETS WITHOUT FOOTPATHS
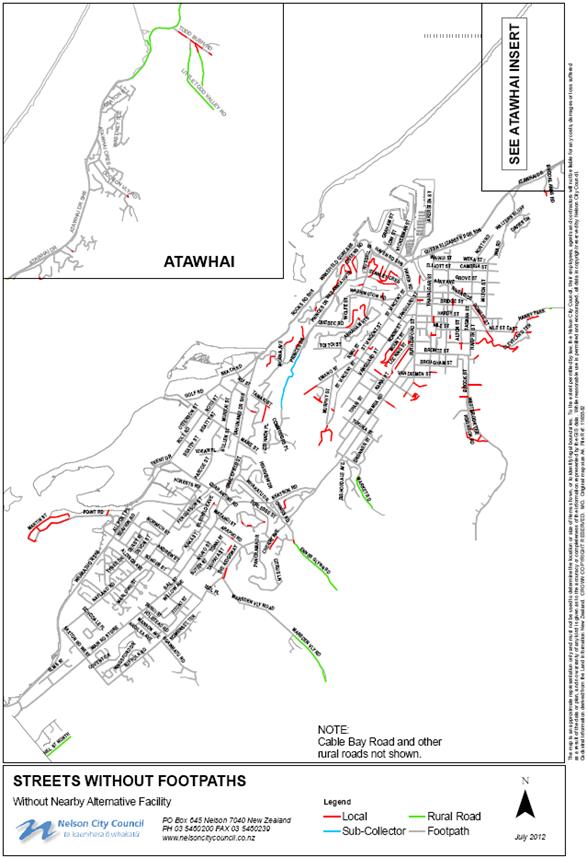
Appendix H Annual
Peak travel time delays on Rocks Road and Waimea Road
Figure H.1 Annual
Average Morning Peak Travel Times – Waimea Road
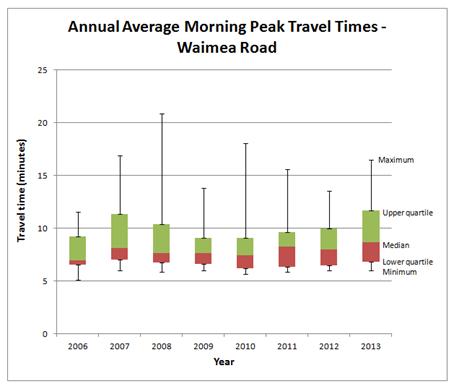
Figure H.2 Annual
Average Evening Peak Travel Times – Waimea Road
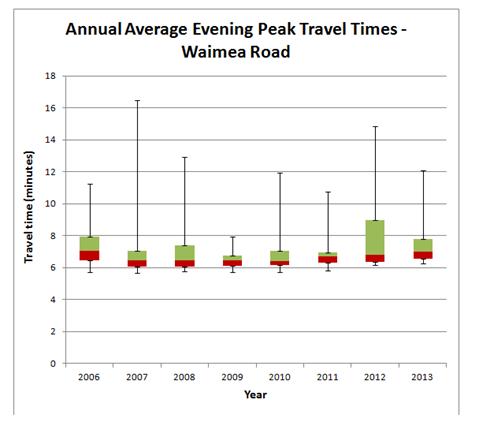
Figure H.3 Annual
Average Morning Peak Travel Times – Rocks Road
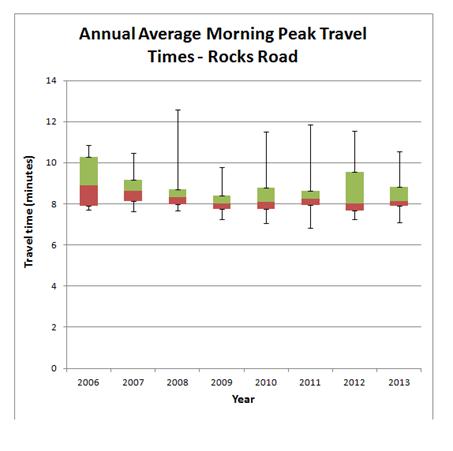
Figure H.4 Annual
Average Evening Peak Travel Times – Rocks Road
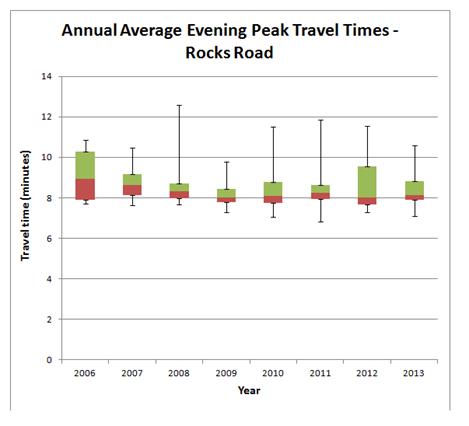
It
is noted that the size of the sample is very small at around 36 surveys in
total per year. As a result there is more variability in the sample then would
be expected from a larger sample and indeed within the population. As a result,
it is proposed to change the survey to increase the sample size.
Appendix I Previous LEVEL OF SERVICE and
why they have changed
|
Service
|
Previous
Level of Service
|
Proposed
Level of Service
|
Reason
for change
|
|
Safety
|
Nelson City
Council cyclist causalities are below the peer group average.
|
The social
and economic costs of crashes on the transport network are minimised
Nelson City
Council crash rates are below the peer group average.
Total social
cost of urban crashes at the worst 10 intersection, is below the previous 5
year average.
The personal
risk for each year reduces at least 2% per year from a base of 2007.
The
collective risk for each year reduces by at least 4% per year from a base of
2007.
The total
social cost for all intersections each year reduces by t least 4% per year
from a base of 2007.
Nelson City
Council pedestrian casualties are below the peer group average.
|
The previous
performance targets are difficult to quantify.
The number of
crashes including pedestrians each year reduces by at least 4% per year from
a base of 2007.
Nelson City
cycle crashes do not increase from these in the base year of 2007.
|
|
Public
Transport
|
Public
transport services that meet the transport needs of the community with an
equitable sharing of costs.
Using the
farebox recovery ratio 30-35% increase to approx 50% between 2015/16 and
2018/19.
|
Farebox
recovery ratio to be greater than 50%.
|
New levels of
service reflects actual improvement in performance to date more accurately.
|
|
Parking
|
Availability
of long stay parking spaces in the interpeak as a percentage of the total
long stay spaces within 20 min walk of the Central Business District, no less
that 5%.
|
A reducing
trend in occupancy of long-stay parking spaces between peak travel times at 9
sample locations within the Central Business District fringe.
|
The new level
of service supports the balanced approach and the and is a better measure of
the parking performance to assist with creating modal shift from single
occupancy vehicles.
|
Appendix J SUMMARY
activity descriptions
This
section contains summary descriptions of key work proposed.
Subsidised Maintenance
Network
and Asset Management 151
· Maintenance of RAMM database ($130.000/year)
o Assumes
roughness and rating measurements and database updated annually.
o Includes $10,000/year for improving
retaining wall and bridge data.
· Bridge inspections ($20,000/year)
· Retaining wall inspections ($31,000 in year 1 and
increasing 2% per year, every year for years 2-10)
o Assumes that there will be a 2% annual growth in retaining
walls due to the land remaining to be developed being predominantly on
hillsides.
· Staff time for operations and maintenance
($250,000/year)
· Staff time for asset management ($60,000/year)
· Corridor access requests ($30,000/year)
· Network wide crash analysis ($10,000/year)
· Pavement testing for informing renewals programme
($50,000/year)
o Dtims, FWD and similar.
· Promotion of car pooling and other travel demand
measures ($57,000/year)
Transportation
Model Update ($40,000)
· Allows for an update of the regional transportation
model once the 2018 census data is available in year 4. This work may be done
as part of a southern arterial study.
· $40,000 has been
allocated in year 4 to review and update the model after the 2018 Census.
Subsidised CAPITAL
EXPENDITURE
Sealed
Road Resurfacing
· 1.33M/year for
years 1-3 and then 1.4M for years 4-10
Pavement
Rehabilitation
· Year 1 - $450,000
· Year 2 - $120,000
· Year 3 - $180,000
· Year 4 - $780,000
· $300,000 per year
there after
· Reflects the need
for the pavement rehabilitation on both Quarantine Road between SH6 and Nayland
Road and Cable Bay Road in Year 1.
Drainage
Renewals 213 ($100,000 in year 1 with 0.6% increase per year, every year for
years 2-10)
· This work has not previously been budgeted for however
work under this category is essential to keep the pavement structure dry.
· Allows for 0.6% growth in the network with new
development.
Traffic
Services Renewals 222
· The single significant item in this work category is
$200,000/year for streetlight renewals in years 1-3 then reducing to
$130,000/year for years 4-10.
Structures
Component Replacement 215
· Average of $380,000pa for first 3 years then 250,000pa
for years 4 to 10.
· Provides for the renewal of bridge and retaining wall
structures, or their major components
Minor
Improvements ($650,000/year)
· Under the current funding regime, minor improvement
projects up to an individual value of $300,000 are permitted without robust
economic justification up to 5% of the total annual transport expenditure. This
allows projects to receive NZ Transport Agency co investment without the rigor
of a full benefit cost analysis.
· Historically Council has progressed minor safety
projects under this budget. In this AMP we have included all projects that are
eligible for NZ Transport Agency co investment.
· The following projects will be completed in year 1:
o Maori Road Retaining Wall
o Home zone projects
o Waimea Road/The Ridgeway Intersection improvements
o Gibbs Bridge – Maitai valley Seismic Upgrade
o Poleford Bridge - Maitai Valley Road seismic upgrade
Waimea
Road/ Van Diemen Street Junction Improvements
· Intersection is highly congested with delays induced
on Waimea Road by drivers stopping to let vehicles into and out of Van Diemen
Street.
· $50,000 in year 8 for investigation, $100,000 in year
9 for detailed design and $1,2M in year 10 for construction.
· Anticipated to be traffic signals at this stage but
Central Business District West traffic study in year 3 will likely define form
and timing.
· Until the investigation work is done it is not
possible to know whether the threshold for funding subsidies will be met. There
is a chance that an appropriate BCR will not be achievable due to the increase in delay to
Waimea Road traffic.
Waimea
Road Retaining Wall at Snows Hill
· $485,000 to secure the steep unsupported cut slope
above Waimea Road at Snows Hill opposite the Girls College Playing Fields.
HPMV
Upgrades – 50Max Maitai Valley Road
· Upgrades to the bridges in the Maitai Valley to
accommodate 50 Max HPMV vehicles. Three bridges to be improved; Smiths Ford,
Jickells and Gibbs bridges.
Quarantine
Road Nayland Road Intersection Upgrade
· Modelling shows that the queues from the intersection
will cause unstable flows as traffic volumes increase.
· $2,75M planned over three years from year 7.
Rocks
Road Walking and Cycling Facilities
· Currently these are no cycle lanes running the full
length of Rocks Road. The Rocks Road Walking and Cycling Study was undertaken
in 2014 to determine the form of the walking and cycling facilities along this
route. At the time of publishing this AMP no final decision has been made.
· Nelson City Councils contribution is $3M in total
spread out over years 1-3. NZ Transport Agency will contribute in the order of
$14M.
· Allows for an improved walking and cycling facility
between Crop and Food Research and Tahunanui Drive.
Maitai
Shared Path (Saltwater Creek Bridge)
· $30,000 in year 1 for design and $345,123 in year 2
for construction.
· Allows for replacement of the existing bridge adjacent
to the Maitai River to allow two-way pedestrian and cycle use.
· Funding for the
Maitai Walkway to Rocks Road link was added during the LTP development.
Tahunanui
Cycle Network
· There is a significant gap in the cycle network
between Rocks Road and Stoke. Vulnerable users are required to negotiate busy
roads with no cycle facilities.
· $100,000 for design in year 1 then $260,000 in year 2
and $500,000 in year 3 for construction.
· Provides a link between the end of Rocks Road and
Stoke. Option 4 in the Opus report for the project is preferred but yet to be confirmed.
UnSubsidised expenditure
Stoke
Foothills Traffic Study ($100,000 in year 1)
· Study to determine the likely effect of growth in the
Marsden and Ngawhatu Valleys on the surrounding transport network.
· The primary focus of the study will be to determine
where future investment in the transport network should occur, particularly on
the links to Main Road Stoke and Waimea Road and along the Ridgeway.
Atawhai
Hills Traffic Study ($100,000 in year 2)
· Study to determine the viability and likely route of a
link road running the length of the Atawhai Hills.
· The Study will include a high level geotechnical assessment
along with a landscape assessment.
· The final route will be included in the Nelson Plan as
an indicative road.
Milton
Street (Grove to Cambria)
· This section of road currently has no kerb and
channel. There is high demand for parking in this location so improving
pedestrian safety with a full height kerb is priority.
· $20,000 for design in year 5 with $500,000/year in years 6
and 7 for construction.
· Allows for the construction of new kerb and channel,
footpaths and carriageway surface and aligns
with stormwater upgrade.
Halifax
Street (Maitai River to Milton)
· $10,000 in year 1 for investigation, $50,000 in year 2 for detailed design
and $600,000 in year 3 for construction.
· Allows for the construction of new kerb and channel
and carriageway surface.
· Aligns with timeline for stormwater upgrades.
Wigzell
Area Speed Reduction
· The primarily residential Wigzell area south of Nelson
hospital has very wide streets with straight alignment. As a result, vehicle
speeds in the area are higher than the ideal 30km/h for a residential zone.
· $10,000 in year 2 for investigation, $40,000 in year 3
for design and $800,000 in year 4 for construction.
· Allows for kerb and channel on Alfred Street and
calming measures on other roads in the area. Stormwater on Alfred Street will be upgraded at the same
time.
· Project removed
from budget and will be funded from Minor Improvements and footpaths renewals
as budgets allow.
Todd
Bush Road
· There is currently no footpath along Todd Bush Road.
There is a school bus stop at the intersection of Todd Bush Road and SH6 and
relatively high demand for its services. A footpath is needed to improve safety
for students walking to and from the bus stop.
· $600,000 for construction in year 1.
· Allows for construction of kerb and channel and a
footpath on one side of Todd Bush Road between SH6 and Todd Reserve.
Main
Road Stoke/Marsden Road
· With access to Waimea Road from The Ridgeway difficult
and unlikely to be improved due to the difficulties in providing additional capacity,
it is important that alternative access to the arterial network is provided.
· Traffic volumes on Main Road Stoke are significantly
lower than on Waimea Road which may make improving side road access at this
intersection more economically viable.
· $30,000 in year 7 for initial investigation, $70,000
in year 8 for design and $900,000 in year 9 for construction.
· Allows for a signalised intersection with minor kerb
changes. No land purchase allowed for.
Lighting
of Railway Reserve
· The current standard of lighting on the Railway
Reserve shared path is non-existent in sections and poor in other areas and
does not provide an adequate level of safety or convenience for users.
· $20,000 has been allocated to undertake a robust
business case.
Muritai
SH6 Including Pedestrian Crossing Across SH6
· The alignment of Muritai Street as its intersection
with SH6 encourages high speed through the left turn from Muritai in
particular. Left turning drivers typically attempt to turn into marginal gaps
in the SH6 traffic while maintaining high speed which is a safety concern.
Crossing SH6 is unsafe for pedestrians unless they direct from their desired
line to the nearby signals.
· $40,000 in year 2
for design and $60,000 in year 5 for
construction.
· Allows for Muritai Street to be squared up to SH6 to
lower vehicle speeds as well as for a pedestrian crossing facility on SH6 north of Muritai Street.
Tahunanui
Car Park
· NZ Transport Agency agreed to remove the clearway on
the east side of Tahunanui Drive to give council four years to find an
alternative location for parking for businesses that currently rely on the
on-street parking. At the end of the four year period, the parking on the east
side will be removed which is expected to increase the capacity of the Bisley
Avenue/SH6 intersection by approximately 10%.
· $50,000 in year 1 for design and $150,000 in year 2
for construction.
· Allows for piping of the open drain adjacent to 23
Tahunanui Drive and construction of a shared parking and access resource over
the old drain, existing chemist parking and right-of-way serving numbers 15, 17 and 19
Tahunanui Drive.
New
Footpaths ($200,000/year)
· There are a large number of streets in Nelson that do
not have footpaths on both sides. While it is ideal to have footpaths on both
sides of all roads, in some situations, like hillside sites, it is difficult to
provide them. In other situations developers have chosen to only provide a
single footpath, particularly on short cul-de-sacs.
· With the limited resources we have available to us, it
is important to prioritise footpath extension projects carefully. Footpath
projects are typically prioritised on the basis of proximity to schools,
whether there is a footpath on the opposite side of the road, the traffic
volume, the zone served by the footpath and whether the project represents
value for money. The priority matrix can be found in A777631, the programme is
included in Appendix L.
· The planned footpath extensions for the 2015/16
financial year are as follows:
o Waimea Road between Chings Road and The Ridgeway.
o Songer Street between Nayland Road and Durham Street.
Footpath
Renewals ($300,000/year)
· A programme of footpath renewals has
been developed based on a City wide footpath condition inspection report. It prioritises
footpaths in higher use areas, close to schools, shops and elderly centres. It
seeks to address the condition of the footpaths to improve pedestrian safety,
comfort and convenience whilst managing the condition of our footpaths with a
timely and economic priority.
Marsden
Valley-Ridgeway Upgrade
· There is an existing road safety problem at this
intersection with limited visibility available on some approaches and
relatively high speeds on The Ridgeway. Minor road marking changes will be
undertaken in the short term.
· Marsden Valley is expected to be one of the largest
sources of population growth in Nelson along with Ngawhatu Valley. All traffic
generated in the valley will use this intersection.
· A roundabout has previously been designed for this
location although significant design changes will be needed.
· $75,000 in year 3 for minor safety works, $120,000 in
year 7 for design, $400,000 in year 8 for property purchase and $1,600,000 in
year 9 for construction.
· Allows for a single lane roundabout.
Marsden
Valley Road
· The current road cross-section and alignment has the
feeling of a high speed rural road which is unsuitable for the residential
activity that it will serve as development grows in the valley.
· $50,000 in year 8 for investigation, $75,000 in year 9
for design and $1.2M in year 10 for construction.
· Allows for localised traffic calming and alignment
changes to reduce speed environment.
Main
Road Stoke Marsden Valley Road
· The Stoke Foothills Study will confirm the form of the
intersection. In order to encourage traffic from that development onto the
arterial network providing an efficient and safe link is necessary.
· $2.0M budgeted over 3 years starting in year 7.
Lucas
Terrace
· Current carriageway needs to be upgraded to local
residential standard to allow for the residential development of the
greenfields site at the end of the current formation.
· $150,000 budgeted over 2 years starting in year 6.
· Removed from budgets. Upgrade will
be funded by developer.
CBD
Enhancement
· This provides a budget to continue the work started
under The Heart of Nelson initiative. Council will need to prioritise projects
which are still relevant during the LTP development.
· $100,000 in year 1 then $500,000 per year for the next
9 years has been provisionally budgeted.
· CBD enhancement.
Project budget cutback:
· Year 1 $50,000 to
develop programme of activities for future years
· Year 2 $250,000
· Year 3 $250,000
· Year 4 $300,000
Parking
Strategy
· The parking strategy, once finalised in 2014 will be
reviewed every 8-10 years in order to ensure that the city’s parking
resources are being used and managed in the most appropriate manner.
· $20,000 in year 7 and $80,000 in year 8 for
development of a new Parking Strategy.
Parking
Strategy Implementation ($270,000 year 1 and $120,000 year2)
· Install signage directing users to the parking squares
from the CBD ring route, $200,000 in 2015/16 and $100,000 in 2016/17.
· Reconfigure the traffic signals on Main Road Stoke at
the Putaitai intersection to allow the right turn out to prevent unnecessary
movements through Strawbridge Square carpark, $40,000 in 2015/16.
· Modify the tree planters in Strawbridge Square carpark
to minimse damage, $30,000 in 2015/16.
· Allocate a small number of campervan and motor home
spaces within the CBD, $20,000 in 2016/17.
Renewals:
On- and Off -Street Parking Meters
· The current parking meters are due for replacement in
the 2015/16 financial year as they have come to the end of their design life.
There has not been any increase in maintenance cost in the last few years
approaching the retirement date so replacement has been deferred until the
2017/18 and 2018/19 financial years.
· The renew would include a technology upgrade to enable
payment by credit card and integration with smart phone apps to extend the
stay.
· $470,000/year in years 3 and 4.
Bus
Services – (WC 511) Subsidised ($710,000/year)
· Allows for wider route coverage of Stoke.
· A large proportion (almost 100%) is expected to be
funded by NZ Transport Agency with Councils costs remaining at a similar level to previous
years.
Stoke
Interchange (WC531)
· It is expected that as Stoke grows that there will be
an increase in bus trips starting and finishing in the Stoke town centre.
· $20,000 in year 8 for design and $200,000 in year 9
for construction.
· Allows for a small central interchange area within the
Stoke town centre area. The location, timing and size will be guided, in part,
by the outcomes of the 2014 Stoke Needs Study.
Integrated
Ticketing (WC531)
· Moving from the current manual ticketing system to an
electronic one for the bus service is required as the current system is
inefficient and nearing its end of life.
· NZ Transport Agency are leading a joint procurement
process in partnership with all of the participating Councils. This approach
allows for the sharing of the up front capital costs based on the size of each
councils service.
· NZ Transport Agency are also subsidising the costs at
a rate of 58%.
· Nelson City Councils share of the total capital cost
will be $61,000 spread over years 1 and 2 and the 2014/15 financial year.
Projects added
· Stoke CBD
enhancements: Year 1 $150,000; Year 3 $100,000; Year 4 $500,000
· Toi Toi Street to
upgrade the upper part of Toi Toi Street to sub collector road standard:
Year 4 $15,000; Year 5 $35,000; Year 6 $400,000. Identified and adopted
as part of Development Contributions Policy deliberations (LTP) to release
further land for residential growth
· Toi Toi Street /
Vanguard Street to improve safety at this intersection: Year 4 $15,000; Year 5
$35,000; Year 6 $250,000. Identified and adopted as part of Development
Contributions Policy deliberations (LTP) to release further land for
residential growth
·
Appendix K Regional
Land Transport Programme 2015-2021
Table 4 - Extract from Regional Land Transport Plan – Agreed Top of the
South Significant Activities.
Nelson projects highlighted in the blue rows
|
Indicative
Ranking
|
Duration
|
Description
|
Organisation
Responsible
|
Phase
|
Region
|
Contributes
to Regional Objectives (refer Table 2 and Appendix 3 of monitoring
performance measures)
|
Performance
Monitoring Measure
|
Cost
|
Profile
(based on 2012 GPS)
|
|
1
|
2015-18
|
SH1
Weld Pass realignment
|
NZTA
|
Design,
Investigation, Planning and Construction
|
Marlborough
|
1,
2, 4
|
Crashes,
resilience, travel time
|
|
HMM-3
|
|
2
|
2015-18
|
SH6
Rai Saddle Second Curve Realignment
|
NZTA
|
Planning
and Construction
|
Nelson
|
1,
4
|
Crashes
|
$7,148,342
|
MHH - 2
|
|
3
|
2015-18
|
SH6
(Whakatu Drive) - Quarantine Road intersection upgrade
|
NZTA
|
Construction
|
Nelson
|
1,
2, 4
|
Travel
time
|
$3,100,000
|
MMH - 4
|
|
4
|
2015-18
|
Walk
Cycle Schools Package
|
|
|
|
|
|
|
MMM - 6
|
|
|
|
Rocks
Road walking and cycling project
|
Nelson
City Council
|
Design
and construction
|
Nelson/NZTA
|
1,3
|
Cycle
and pedestrian growth, cycle crashes
|
$14,250,000
|
|
|
|
|
Tahunanui
cycle network
|
Nelson
City Council
|
Design
and construction
|
Nelson
|
1,3
|
Cycle
and pedestrian growth, cycle crashes
|
$860,000
|
|
|
|
|
Rocks
Road – Maitai path (Saltwater Creek bridge only)
|
Nelson
City Council
|
Design
and construction
|
Nelson
|
1,3
|
Cycle
and pedestrian growth, cycle crashes
|
$375,100
|
|
|
5
|
2018-21
|
SH6
Aniseed Valley to Saxton Corridor Strategic Business Case
|
NZTA
|
Investigate,
design and planning
|
Tasman/Nelson
|
1,2,4
|
Travel
time
|
|
|
|
6
|
2018-21
|
SH6
Whangamoa South realignment Stage 1 (include Teal River bridge realignment
and lower bends)
|
NZTA
|
Design
and construction
|
Nelson
|
1,
2, 3,4
|
Crashes,
travel time, resilience
|
|
|
|
7
|
2018-21
|
SH
6 Rai Saddle Section C Curve Realignment
|
NZTA
|
Investigate,
design and construction
|
Marlborough
|
1,
4
|
Crashes
|
|
|
|
8
|
2018-21
|
SH6
Whangamoa South realignment Stage 2
|
NZTA
|
Design
and construction
|
Nelson
|
1,2,3,4
|
Crashes,
travel time, resilience
|
|
|
|
9
|
2018-21
|
SH6
Hope Saddle realignment
|
NZTA
|
Investigate,
design, planning and construction
|
Tasman
|
1,4
|
Crashes,
travel time, resilience
|
|
|
|
10
|
2018-21
|
SH60
Motueka River bridge widening
|
NZTA
|
Investigate,
design and construct
|
Tasman
|
1,2,3,4
|
Travel
time, resilience, safety
|
|
|
|
11
|
2015-18
|
Efficient
freight and commuter route from Annesbrook to Haven e.g. Southern Arterial
Investigations or existing route capacity improvements
|
NZTA/
Nelson
City Council
|
Business
Case
|
Nelson/
Tasman
|
1,2,4
|
Travel
time, resilience
|
|
|
Table 6 - Extract from Regional Land
Transport Plan - Activities proposed within Nelson City (Refer Table 4 for
significant Nelson and inter-regional activities)
|
Duration
|
Activity
|
Organisation
Responsible
|
Contributes to
Objectives
|
Performance Monitoring
Measure
|
Total Cost
|
NLTF Share
|
Assessment Framework
|
Priority
|
|
2015-18
|
SH Minor Improvements
|
NZTA
|
1,2,3,4,N4
|
Various
|
$900,000
|
$900,000
|
HMH - 2
|
1
|
|
2015-18
|
Public Transport
Integrated Ticketing (WC531)
|
Nelson City Council
|
1,4,N1,N2,N3
|
Bus Patronage Growth
|
$129,200
|
$61,662
|
HHM - 2
|
2
|
|
2016-19
|
Rocks Rd to Maitai Path
(Extension of Rocks Road shared path to Maitai path)
|
NZTA/Nelson City
Council
|
1, N1,N3, N4
|
Cycle growth and cycle
crashes
|
$1,800,000
|
$914,400
|
MMM - 6
|
3
|
|
2017-20
|
HPMV Upgrades - 50MAX
Maitai Valley Road
|
Nelson City Council
|
1,3,4,N3
|
50 Max HPMV Route
availability
|
$450,000
|
$226,500
|
MLH - 7
|
4
|
|
2015-18
|
Enhanced Network
Resilience Nelson
|
NZTA
|
1,3,4
|
Unplanned closures
|
|
|
HLL - 8
|
5
|
|
2015-18
|
SH6 (Whakatu Drive)
north-bound capacity improvements
|
NZTA
|
1,2,4
|
Travel Time
|
$2,500,000
|
$2,500,000
|
MLM - 8
|
6
|
|
2018-21
|
SH6 Cable Bay Road
Intersection
|
NZTA
|
1,N4
|
Crashes
|
|
|
MLM - 8
|
7
|
|
2018-21
|
Weigh Facility Nelson
|
NZTA
|
4
|
Crashes
|
$3,740,000
|
$3,740,000
|
HML - 5
|
9
|
|
2018-21
|
Stoke Bus Interchange
(WC531)
|
Nelson City Council
|
1,3,N1,N2,N3
|
Bus Patronage Growth
|
$320,000
|
$166,400
|
MMM - 6
|
10
|
|
Duration
|
Activity
|
Organisation
Responsible
|
Contributes to
Objectives
|
Performance Monitoring
Measure
|
Total Cost
|
NLTF Share
|
Assessment Framework
|
Priority
|
|
2015-24
|
Quarantine/Nayland
intersection upgrades
|
Nelson City Council
|
1,2,4,N3,N4
|
Travel time
|
$2,750,000
|
$1,430,000
|
MMM - 6
|
11
|
|
2021-24
|
Waimea Rd/Van Diemen
Jct improvements
|
Nelson City Council
|
1,4,N4
|
Travel time delay
|
$1,350,000
|
$702,000
|
MLL - 10
|
12
|
|
2021-24
|
Parkers Road/SH6
intersection improvements
|
NZTA
|
1,2,4,N2
|
Travel time delay
|
$1,200,000
|
$1,200,000
|
|
13
|
APPENDIX l 10
YEAR LONG TERM PLAN – PROGRAMME
|
Account
|
Total
Budget
LTP
2015/16
|
Total
Budget
LTP
2016/17
|
Total
Budget
LTP
2017/18
|
Total
Budget
LTP
2018/19
|
Total
Budget
LTP
2019/20
|
Total
Budget
LTP
2020/21
|
Total
Budget
LTP
2021/22
|
Total
Budget
LTP
2022/23
|
Total
Budget
LTP
2023/24
|
Total
Budget
LTP
2024/25
|
|
Grand Total
|
15,363,194
|
13,283,425
|
17,922,419
|
13,142,840
|
13,287,435
|
13,037,735
|
12,430,881
|
12,593,009
|
16,977,287
|
14,284,655
|
|
|
|
|
|
|
|
|
|
|
|
|
|
5001 Subsidised
Roading
|
7,676,970
|
6,518,455
|
8,307,096
|
6,598,612
|
6,528,547
|
5,943,151
|
5,998,435
|
6,139,056
|
8,590,025
|
7,146,357
|
|
Base Expenditure
|
3,039,100
|
3,056,380
|
3,103,771
|
3,118,310
|
3,137,221
|
3,185,719
|
3,159,890
|
3,179,392
|
3,229,234
|
3,204,434
|
|
Base Service Provision Council Wide
|
90,000
|
89,994
|
90,045
|
90,000
|
90,000
|
90,000
|
90,000
|
90,000
|
90,000
|
90,000
|
|
500123101221. WC 432 Road Safety Promotion
|
90,000
|
89,994
|
90,045
|
90,000
|
90,000
|
90,000
|
90,000
|
90,000
|
90,000
|
90,000
|
|
Base Maintenance
|
2,934,100
|
2,946,355
|
2,958,688
|
3,013,310
|
3,027,221
|
3,040,719
|
3,054,890
|
3,069,392
|
3,084,234
|
3,099,434
|
|
500120100117. WC 151 Network and Asset Management Expenses
|
581,000
|
581,591
|
582,237
|
582,897
|
583,555
|
584,227
|
584,911
|
585,609
|
586,321
|
587,048
|
|
500120100118. WC 124 Cycle Path Maintenance
|
57,000
|
60,875
|
64,862
|
69,137
|
73,954
|
78,274
|
83,187
|
88,347
|
93,764
|
99,452
|
|
500120100119. WC 111 Sealed Pavement Maintenance
|
500,000
|
503,029
|
506,024
|
509,054
|
512,108
|
515,181
|
518,272
|
521,382
|
524,510
|
527,657
|
|
500120100120. WC 112 Unsealed Pavement Maintenance
|
45,000
|
45,242
|
45,499
|
45,815
|
46,090
|
46,366
|
46,645
|
46,924
|
47,206
|
47,489
|
|
500120100121. WC 113 Routine Drainage Maintenance
|
135,900
|
136,799
|
137,547
|
138,408
|
139,238
|
140,074
|
140,914
|
141,760
|
142,610
|
143,466
|
|
500120100122. WC 114 Structures Maintenance
|
170,000
|
170,999
|
172,077
|
173,078
|
174,117
|
175,162
|
176,213
|
177,270
|
178,333
|
179,403
|
|
500120100123. WC 121 Pest control on road reserve
|
463,000
|
464,920
|
466,724
|
544,189
|
546,614
|
549,054
|
551,508
|
553,977
|
556,461
|
558,960
|
|
500120100124. WC 122 Traffic Services Maintenance
|
908,900
|
909,615
|
910,461
|
880,932
|
881,745
|
882,581
|
883,440
|
884,323
|
885,229
|
886,159
|
|
500120100125. WC 123 Operational Traffic Management
|
73,300
|
73,285
|
73,257
|
69,800
|
69,800
|
69,800
|
69,800
|
69,800
|
69,800
|
69,800
|
|
Base General Operating Expense
|
15,000
|
20,031
|
55,038
|
15,000
|
20,000
|
55,000
|
15,000
|
20,000
|
55,000
|
15,000
|
|
500126011475. Regional Land Tspt Programme
|
15,000
|
20,031
|
55,038
|
15,000
|
20,000
|
55,000
|
15,000
|
20,000
|
55,000
|
15,000
|
|
Programmed Expenses
|
30,000
|
50,000
|
50,000
|
70,000
|
50,000
|
50,000
|
30,000
|
50,000
|
50,000
|
30,000
|
|
Programmed Service Provision
|
30,000
|
50,000
|
50,000
|
70,000
|
50,000
|
50,000
|
30,000
|
50,000
|
50,000
|
30,000
|
|
500143222163. WC 003 Activity Management Planning Improvement Expenses
|
10,000
|
30,000
|
30,000
|
10,000
|
30,000
|
30,000
|
10,000
|
30,000
|
30,000
|
10,000
|
|
500143222164. Studies & Strategies
|
20,000
|
20,000
|
20,000
|
20,000
|
20,000
|
20,000
|
20,000
|
20,000
|
20,000
|
20,000
|
|
500143722514. Transportation model update
|
0
|
0
|
0
|
40,000
|
0
|
0
|
0
|
0
|
0
|
0
|
|
Renewals
|
2,399,584
|
2,319,248
|
2,221,241
|
2,607,630
|
2,239,448
|
2,130,092
|
2,139,691
|
2,148,769
|
2,256,737
|
2,210,151
|
|
Renewals: Infrastructure
|
2,399,584
|
2,319,248
|
2,221,241
|
2,607,630
|
2,239,448
|
2,130,092
|
2,139,691
|
2,148,769
|
2,256,737
|
2,210,151
|
|
500173551539. WC 214 Sealed Road Pavement Rehabilitation
|
450,000
|
117,045
|
276,398
|
777,778
|
322,703
|
322,703
|
322,703
|
322,703
|
322,703
|
322,703
|
|
500173551540. WC 212 Sealed Road Resurfacing
|
1,326,000
|
1,333,885
|
1,329,959
|
1,397,000
|
1,397,000
|
1,397,000
|
1,397,000
|
1,397,000
|
1,397,000
|
1,397,000
|
|
500173551542. WC 211 Unsealed Road Metalling
|
58,000
|
57,986
|
58,014
|
58,000
|
58,000
|
58,000
|
58,000
|
58,000
|
58,000
|
58,000
|
|
500173601538. WC 213 Drainage Renewals
|
100,000
|
100,575
|
101,216
|
101,811
|
102,422
|
103,036
|
103,654
|
104,276
|
104,902
|
105,531
|
|
500173651537. Structures Component Replacement 215
|
307,021
|
507,825
|
317,416
|
250,000
|
250,000
|
250,000
|
250,000
|
250,000
|
250,000
|
250,000
|
|
500173901541. WC 222 Traffic Service Renewals
|
405,000
|
425,495
|
365,935
|
266,449
|
266,937
|
267,429
|
267,924
|
268,421
|
268,922
|
269,425
|
|
Capital Growth
|
134,845
|
0
|
0
|
0
|
0
|
0
|
0
|
0
|
0
|
0
|
|
Capital Growth: Infrastructure
|
134,845
|
0
|
0
|
0
|
0
|
0
|
0
|
0
|
0
|
0
|
|
500176752172. Railway Reserve/Princess Dr extension overbridge
|
104,000
|
0
|
0
|
0
|
0
|
0
|
0
|
0
|
0
|
0
|
|
500176801212. Nile Street shared path (Brook Area extension)
|
40,000
|
0
|
0
|
0
|
0
|
0
|
0
|
0
|
0
|
0
|
|
Capital Increased LOS
|
2,073,441
|
1,092,827
|
2,932,084
|
802,672
|
1,101,878
|
577,340
|
668,854
|
760,895
|
3,054,054
|
1,701,772
|
|
Capital Increased LOS: Infrastructure
|
2,073,441
|
1,092,827
|
2,932,084
|
802,672
|
1,101,878
|
577,340
|
668,854
|
760,895
|
3,054,054
|
1,701,772
|
|
500179551525. Minor Improvements 341
|
650,000
|
650,000
|
650,000
|
650,000
|
650,000
|
650,000
|
650,000
|
650,000
|
650,000
|
650,000
|
|
500179552168. Waimea Rd/Van Diemen Jct improvements
|
0
|
0
|
0
|
0
|
0
|
0
|
0
|
50,000
|
100,000
|
1,200,000
|
|
500179552934. Quarantine/Nayland intersection upgrades
|
0
|
0
|
0
|
0
|
0
|
0
|
100,000
|
150,000
|
2,500,000
|
0
|
|
500179552935. HPMV Upgrades: 50MAX Maitai Valley Road
|
0
|
0
|
50,000
|
200,000
|
200,000
|
0
|
0
|
0
|
0
|
0
|
|
500179752531. School frontage Nelson College
|
15,000
|
0
|
0
|
0
|
0
|
0
|
0
|
0
|
0
|
0
|
|
500179801227. WC 452 Bishopdale to Ridgeway Shared Path
|
289,382
|
0
|
0
|
0
|
0
|
0
|
0
|
0
|
0
|
0
|
|
500179801314. Maitai shared path (Saltwater Creek Bridge)
|
47,000
|
30,000
|
345,123
|
0
|
0
|
0
|
0
|
0
|
0
|
0
|
|
500179802173. Maitai shared path (Collingwood St to Nile St)
|
600,000
|
0
|
0
|
0
|
0
|
0
|
0
|
0
|
0
|
0
|
|
500179802199. Waimea Road Retaining Wall at Snows Hill
|
0
|
0
|
0
|
50,000
|
435,000
|
0
|
0
|
0
|
0
|
0
|
|
500179802333. Tahunanui Cycle Network
|
100,000
|
260,000
|
500,000
|
0
|
0
|
0
|
0
|
0
|
0
|
0
|
|
500179802568. Walk cycle Schools Package: Integrated Activities
|
150,000
|
0
|
0
|
0
|
0
|
0
|
0
|
0
|
0
|
0
|
|
500179802695. Wood to Intermediate Part C,via Colleges
|
100,000
|
0
|
0
|
0
|
0
|
0
|
0
|
0
|
0
|
0
|
|
500179802697. Whakatu Drive / Beatson Road
|
17,203
|
0
|
0
|
0
|
0
|
0
|
0
|
0
|
0
|
0
|
|
500179802699. Railway Reserve to CBD (Stg II via St Vincent (Gloucester St
|
160,000
|
0
|
0
|
0
|
0
|
0
|
0
|
0
|
0
|
0
|
|
500179802932. Rocks Rd to Maitai shared path
|
30,000
|
270,000
|
1,500,000
|
0
|
0
|
0
|
0
|
0
|
0
|
0
|
|
5002
Unsubsidised Roading
|
3,370,477
|
2,522,729
|
4,985,040
|
1,837,416
|
2,064,863
|
2,972,378
|
2,479,955
|
2,357,460
|
4,420,068
|
3,052,899
|
|
Base Expenditure
|
1,164,926
|
1,115,177
|
1,120,458
|
1,025,773
|
1,031,119
|
1,036,496
|
1,041,907
|
1,047,349
|
1,052,825
|
1,058,332
|
|
Base Service Provision Council Wide
|
157,439
|
117,439
|
117,439
|
17,439
|
17,439
|
17,439
|
17,439
|
17,439
|
17,439
|
17,439
|
|
500223100298. Provide Corridor Access Requests
|
10,000
|
10,000
|
10,000
|
10,000
|
10,000
|
10,000
|
10,000
|
10,000
|
10,000
|
10,000
|
|
500223100435. Christmas/New Year Road Closures
|
7,439
|
7,439
|
7,439
|
7,439
|
7,439
|
7,439
|
7,439
|
7,439
|
7,439
|
7,439
|
|
500223100728. Corridor Access Requests UFB
|
140,000
|
100,000
|
100,000
|
0
|
0
|
0
|
0
|
0
|
0
|
0
|
|
Base Maintenance
|
898,105
|
888,356
|
893,637
|
898,952
|
904,298
|
909,675
|
915,086
|
920,528
|
926,004
|
931,511
|
|
50022010. Road & Footpath Maintenance
|
273,000
|
274,638
|
276,286
|
277,944
|
279,611
|
281,289
|
282,977
|
284,674
|
286,383
|
288,101
|
|
500220100409. Street and Sump Cleaning
|
177,000
|
178,374
|
179,756
|
181,147
|
182,546
|
183,953
|
185,369
|
186,793
|
188,226
|
189,667
|
|
500220100448. Mtce: Rocks Rd Bollards
|
30,000
|
30,000
|
30,000
|
30,000
|
30,000
|
30,000
|
30,000
|
30,000
|
30,000
|
30,000
|
|
500220100622. Artwork Maintenance
|
10,000
|
10,000
|
10,000
|
10,000
|
10,000
|
10,000
|
10,000
|
10,000
|
10,000
|
10,000
|
|
50022016. Street Tree Maintenance
|
150,000
|
150,900
|
151,805
|
152,716
|
153,633
|
154,554
|
155,482
|
156,415
|
157,353
|
158,297
|
|
500220160410. Street Garden Maintenance
|
223,105
|
224,444
|
225,790
|
227,145
|
228,508
|
229,879
|
231,258
|
232,646
|
234,042
|
235,446
|
|
50022017. After Hours Duty Officer
|
20,000
|
20,000
|
20,000
|
20,000
|
20,000
|
20,000
|
20,000
|
20,000
|
20,000
|
20,000
|
|
50022041. Footpath Maintenance
|
15,000
|
0
|
0
|
0
|
0
|
0
|
0
|
0
|
0
|
0
|
|
Base General Operating Expense
|
60,882
|
60,882
|
60,882
|
60,882
|
60,882
|
60,882
|
60,882
|
60,882
|
60,882
|
60,882
|
|
50022617. Electricity Non Sub
|
12,567
|
12,567
|
12,567
|
12,567
|
12,567
|
12,567
|
12,567
|
12,567
|
12,567
|
12,567
|
|
500226200685. Rental: Maitai / Wakatu
|
6,667
|
6,667
|
6,667
|
6,667
|
6,667
|
6,667
|
6,667
|
6,667
|
6,667
|
6,667
|
|
50022621. Rates
|
5,965
|
5,965
|
5,965
|
5,965
|
5,965
|
5,965
|
5,965
|
5,965
|
5,965
|
5,965
|
|
50022625. Streetgarden water
|
8,223
|
8,223
|
8,223
|
8,223
|
8,223
|
8,223
|
8,223
|
8,223
|
8,223
|
8,223
|
|
50022637. Insurance
|
20,460
|
20,460
|
20,460
|
20,460
|
20,460
|
20,460
|
20,460
|
20,460
|
20,460
|
20,460
|
|
500226450692. Temporary Road closure expense
|
7,000
|
7,000
|
7,000
|
7,000
|
7,000
|
7,000
|
7,000
|
7,000
|
7,000
|
7,000
|
|
Base Consultants
|
48,500
|
48,500
|
48,500
|
48,500
|
48,500
|
48,500
|
48,500
|
48,500
|
48,500
|
48,500
|
|
50022710. Legal Fees
|
40,000
|
40,000
|
40,000
|
40,000
|
40,000
|
40,000
|
40,000
|
40,000
|
40,000
|
40,000
|
|
50022720. Valuation Fees
|
8,500
|
8,500
|
8,500
|
8,500
|
8,500
|
8,500
|
8,500
|
8,500
|
8,500
|
8,500
|
|
Unprogrammed Expenses
|
200,000
|
0
|
0
|
0
|
0
|
0
|
0
|
0
|
0
|
0
|
|
Unprogrammed Maintenance
|
200,000
|
0
|
0
|
0
|
0
|
0
|
0
|
0
|
0
|
0
|
|
500230911996. Emergency 2011 Response
|
200,000
|
0
|
0
|
0
|
0
|
0
|
0
|
0
|
0
|
0
|
|
Programmed Expenses
|
318,000
|
158,000
|
158,000
|
58,000
|
58,000
|
58,000
|
58,000
|
58,000
|
58,000
|
58,000
|
|
Programmed Service Provision
|
260,000
|
100,000
|
100,000
|
0
|
0
|
0
|
0
|
0
|
0
|
0
|
|
500243222515. Southern Arterial Corridor Management Plan
|
50,000
|
0
|
0
|
0
|
0
|
0
|
0
|
0
|
0
|
0
|
|
50024372. Prelim Capex - investigation, options, testing
|
10,000
|
0
|
0
|
0
|
0
|
0
|
0
|
0
|
0
|
0
|
|
500243722936. Atawhai Hills Traffic Study
|
0
|
100,000
|
0
|
0
|
0
|
0
|
0
|
0
|
0
|
0
|
|
500243722937. CBD West traffic study
|
0
|
0
|
100,000
|
0
|
0
|
0
|
0
|
0
|
0
|
0
|
|
500243722939. Stoke Foothills Traffic Study
|
100,000
|
0
|
0
|
0
|
0
|
0
|
0
|
0
|
0
|
0
|
|
500243722946. Railway Reserve Lighting feasibility
|
20,000
|
0
|
0
|
0
|
0
|
0
|
0
|
0
|
0
|
0
|
|
500243722996. Stoke CBD study
|
80,000
|
0
|
0
|
0
|
0
|
0
|
0
|
0
|
0
|
0
|
|
Programmed Maintenance
|
58,000
|
58,000
|
58,000
|
58,000
|
58,000
|
58,000
|
58,000
|
58,000
|
58,000
|
58,000
|
|
50024041. Pest Control on Road Reserve
|
10,000
|
10,000
|
10,000
|
10,000
|
10,000
|
10,000
|
10,000
|
10,000
|
10,000
|
10,000
|
|
500240701078. Replacement Planting
|
48,000
|
48,000
|
48,000
|
48,000
|
48,000
|
48,000
|
48,000
|
48,000
|
48,000
|
48,000
|
|
Renewals
|
310,551
|
312,552
|
314,582
|
316,643
|
318,744
|
320,882
|
323,048
|
325,111
|
327,243
|
329,567
|
|
Renewals General
|
5,551
|
5,752
|
5,971
|
6,211
|
6,479
|
6,773
|
7,085
|
7,282
|
7,537
|
7,973
|
|
50027150. Renewals: Street/Garden Furniture
|
5,551
|
5,752
|
5,971
|
6,211
|
6,479
|
6,773
|
7,085
|
7,282
|
7,537
|
7,973
|
|
Renewals: Infrastructure
|
305,000
|
306,800
|
308,611
|
310,432
|
312,265
|
314,109
|
315,963
|
317,829
|
319,706
|
321,594
|
|
500273701504. Renewals: Street Lights on walkways
|
5,000
|
5,000
|
5,000
|
5,000
|
5,000
|
5,000
|
5,000
|
5,000
|
5,000
|
5,000
|
|
500273751494. Renewals: Footpaths
|
300,000
|
301,800
|
303,611
|
305,432
|
307,265
|
309,109
|
310,963
|
312,829
|
314,706
|
316,594
|
|
Capital Growth
|
700,000
|
100,000
|
175,000
|
100,000
|
100,000
|
100,000
|
250,000
|
620,000
|
2,675,000
|
1,300,000
|
|
Capital Growth
|
100,000
|
100,000
|
100,000
|
100,000
|
100,000
|
100,000
|
100,000
|
100,000
|
100,000
|
100,000
|
|
50027410. Sundry Land Purchases - Growth
|
100,000
|
100,000
|
100,000
|
100,000
|
100,000
|
100,000
|
100,000
|
100,000
|
100,000
|
100,000
|
|
Capital Growth: Infrastructure
|
600,000
|
0
|
75,000
|
0
|
0
|
0
|
150,000
|
520,000
|
2,575,000
|
1,200,000
|
|
500276551375. Marsden Valley Ridgeway Upgrade
|
0
|
0
|
75,000
|
0
|
0
|
0
|
120,000
|
400,000
|
1,600,000
|
0
|
|
500276552193. Todd Bush Rd
|
600,000
|
0
|
0
|
0
|
0
|
0
|
0
|
0
|
0
|
0
|
|
500276552200. Marsden Valley Road Upgrade
|
0
|
0
|
0
|
0
|
0
|
0
|
0
|
50,000
|
75,000
|
1,200,000
|
|
500276552933. Main Rd Stoke/Marsden Rd
|
0
|
0
|
0
|
0
|
0
|
0
|
30,000
|
70,000
|
900,000
|
0
|
|
Capital Increased LOS
|
677,000
|
837,000
|
3,217,000
|
337,000
|
557,000
|
1,457,000
|
807,000
|
307,000
|
307,000
|
307,000
|
|
Capital Increased LOS
|
97,000
|
97,000
|
107,000
|
107,000
|
107,000
|
107,000
|
107,000
|
107,000
|
107,000
|
107,000
|
|
50027710. Land Purchase - LOS
|
50,000
|
50,000
|
50,000
|
50,000
|
50,000
|
50,000
|
50,000
|
50,000
|
50,000
|
50,000
|
|
500277701076. Road Frontage Planting Program
|
25,000
|
25,000
|
35,000
|
35,000
|
35,000
|
35,000
|
35,000
|
35,000
|
35,000
|
35,000
|
|
500277701078. Street Garden Dev
|
7,000
|
7,000
|
7,000
|
7,000
|
7,000
|
7,000
|
7,000
|
7,000
|
7,000
|
7,000
|
|
500277701079. Street Tree Dev
|
15,000
|
15,000
|
15,000
|
15,000
|
15,000
|
15,000
|
15,000
|
15,000
|
15,000
|
15,000
|
|
Capital Increased LOS: Infrastructure
|
530,000
|
590,000
|
3,110,000
|
230,000
|
450,000
|
1,350,000
|
700,000
|
200,000
|
200,000
|
200,000
|
|
500279552058. Tasman St (Nile to Bronte)
|
70,000
|
0
|
0
|
0
|
0
|
0
|
0
|
0
|
0
|
0
|
|
500279552074. Milton St (Grove to Cambria)
|
0
|
0
|
0
|
0
|
20,000
|
500,000
|
500,000
|
0
|
0
|
0
|
|
500279552075. Halifax (Maitai to Milton)
|
10,000
|
50,000
|
600,000
|
0
|
0
|
0
|
0
|
0
|
0
|
0
|
|
500279552193. Todd Bush Rd
|
10,000
|
0
|
0
|
0
|
0
|
0
|
0
|
0
|
0
|
0
|
|
500279552947. Muritai SH6 intersection (incl Ped crossing across SH6)
|
0
|
40,000
|
0
|
0
|
160,000
|
0
|
0
|
0
|
0
|
0
|
|
500279553009. Toi Toi/Vanguard intersection upgrade
|
0
|
0
|
0
|
15,000
|
35,000
|
250,000
|
0
|
0
|
0
|
0
|
|
500279553010. Toi Toi St upgrade
|
0
|
0
|
0
|
15,000
|
35,000
|
400,000
|
0
|
0
|
0
|
0
|
|
500279752798. New Footpaths
|
50,000
|
200,000
|
200,000
|
200,000
|
200,000
|
200,000
|
200,000
|
200,000
|
200,000
|
200,000
|
|
500279802213. Rocks Rd cycling and walking project
|
390,000
|
300,000
|
2,310,000
|
0
|
0
|
0
|
0
|
0
|
0
|
0
|
|
Capital LOS: Other Property Improvements
|
50,000
|
150,000
|
0
|
0
|
0
|
0
|
0
|
0
|
0
|
0
|
|
500278552948. Tahunanui car park
|
50,000
|
150,000
|
0
|
0
|
0
|
0
|
0
|
0
|
0
|
0
|
|
5505 Parking
Regulation
|
570,192
|
570,192
|
570,192
|
570,192
|
570,192
|
570,192
|
570,192
|
570,192
|
570,192
|
570,192
|
|
Base Expenditure
|
570,192
|
570,192
|
570,192
|
570,192
|
570,192
|
570,192
|
570,192
|
570,192
|
570,192
|
570,192
|
|
Base Service Provision Council Wide
|
560,692
|
560,692
|
560,692
|
560,692
|
560,692
|
560,692
|
560,692
|
560,692
|
560,692
|
560,692
|
|
55052310. Providing Parking Reg Service
|
37,000
|
37,000
|
37,000
|
37,000
|
37,000
|
37,000
|
37,000
|
37,000
|
37,000
|
37,000
|
|
550523100453. Vehicle Identification Fee/MOT
|
500
|
500
|
500
|
500
|
500
|
500
|
500
|
500
|
500
|
500
|
|
550523100454. Court Processing
|
115,000
|
115,000
|
115,000
|
115,000
|
115,000
|
115,000
|
115,000
|
115,000
|
115,000
|
115,000
|
|
550523100700. Providing service - EIL contract
|
408,192
|
408,192
|
408,192
|
408,192
|
408,192
|
408,192
|
408,192
|
408,192
|
408,192
|
408,192
|
|
Base General Operating Expense
|
9,500
|
9,500
|
9,500
|
9,500
|
9,500
|
9,500
|
9,500
|
9,500
|
9,500
|
9,500
|
|
55052650. Flea Market Towing
|
9,500
|
9,500
|
9,500
|
9,500
|
9,500
|
9,500
|
9,500
|
9,500
|
9,500
|
9,500
|
|
5510 Car Parking
|
2,373,498
|
2,248,821
|
2,682,191
|
2,688,510
|
2,294,160
|
1,801,537
|
1,858,932
|
1,971,340
|
1,808,762
|
1,846,200
|
|
Base Expenditure
|
1,741,130
|
1,743,453
|
1,745,791
|
1,748,142
|
1,763,792
|
1,766,169
|
1,768,564
|
1,770,972
|
1,773,394
|
1,775,832
|
|
Base Service Provision Council Wide
|
211,934
|
212,099
|
212,265
|
212,432
|
212,600
|
212,769
|
212,939
|
213,110
|
213,282
|
213,455
|
|
55102310. Provide: CBD Professional Serv
|
27,500
|
27,665
|
27,831
|
27,998
|
28,166
|
28,335
|
28,505
|
28,676
|
28,848
|
29,021
|
|
551023100701. Provide: CCTV Operation
|
43,000
|
43,000
|
43,000
|
43,000
|
43,000
|
43,000
|
43,000
|
43,000
|
43,000
|
43,000
|
|
55102342. Provide CBD Coordinator
|
141,434
|
141,434
|
141,434
|
141,434
|
141,434
|
141,434
|
141,434
|
141,434
|
141,434
|
141,434
|
|
Base Maintenance
|
653,262
|
655,420
|
657,592
|
659,776
|
661,974
|
664,184
|
666,409
|
668,646
|
670,896
|
673,161
|
|
551020100414. Mtce: Off Street Parking Meters
|
63,528
|
63,528
|
63,528
|
63,528
|
63,528
|
63,528
|
63,528
|
63,528
|
63,528
|
63,528
|
|
551020100415. Mtce: On Street Parking Meters
|
130,000
|
130,000
|
130,000
|
130,000
|
130,000
|
130,000
|
130,000
|
130,000
|
130,000
|
130,000
|
|
551020100457. Mtce: CBD Street Sweeping
|
95,000
|
95,570
|
96,143
|
96,720
|
97,301
|
97,884
|
98,472
|
99,063
|
99,657
|
100,255
|
|
551020100458. Clean Asphalt Footpaths
|
137,000
|
137,822
|
138,649
|
139,481
|
140,318
|
141,160
|
142,007
|
142,859
|
143,716
|
144,578
|
|
55102016. Mtce: Street Gardens
|
8,000
|
8,048
|
8,096
|
8,145
|
8,194
|
8,243
|
8,292
|
8,342
|
8,392
|
8,443
|
|
551020160410. Mtce: Street Trees
|
20,000
|
20,120
|
20,241
|
20,362
|
20,484
|
20,607
|
20,731
|
20,855
|
20,980
|
21,106
|
|
551020160416. Mtce: Blockwork Maintenance
|
80,000
|
80,480
|
80,963
|
81,449
|
81,937
|
82,429
|
82,924
|
83,421
|
83,922
|
84,425
|
|
551020160417. Mtce: Carpark Maintenance
|
19,734
|
19,852
|
19,972
|
20,091
|
20,212
|
20,333
|
20,455
|
20,578
|
20,701
|
20,826
|
|
551020161267. Hanging Baskets
|
80,000
|
80,000
|
80,000
|
80,000
|
80,000
|
80,000
|
80,000
|
80,000
|
80,000
|
80,000
|
|
55102029. Mtce: CBD Seat Cleaning
|
20,000
|
20,000
|
20,000
|
20,000
|
20,000
|
20,000
|
20,000
|
20,000
|
20,000
|
20,000
|
|
Base General Operating Expense
|
866,549
|
866,549
|
866,549
|
866,549
|
879,833
|
879,831
|
879,831
|
879,831
|
879,831
|
879,831
|
|
55102608. CBD Wifi
|
44,000
|
44,000
|
44,000
|
44,000
|
44,000
|
44,000
|
44,000
|
44,000
|
44,000
|
44,000
|
|
55102617. Electricity car parks
|
16,120
|
16,120
|
16,120
|
16,120
|
16,120
|
16,120
|
16,120
|
16,120
|
16,120
|
16,120
|
|
55102620. Rent (Wakatu Leases)
|
201,274
|
201,274
|
201,274
|
201,274
|
201,274
|
201,274
|
201,274
|
201,274
|
201,274
|
201,274
|
|
55102621. Rates
|
377,931
|
377,931
|
377,931
|
377,931
|
377,931
|
377,931
|
377,931
|
377,931
|
377,931
|
377,931
|
|
55102625. Water By Meter
|
1,316
|
1,316
|
1,316
|
1,316
|
1,316
|
1,316
|
1,316
|
1,316
|
1,316
|
1,316
|
|
55102627. Mtce: CBD Litter Collection
|
26,566
|
26,566
|
26,566
|
26,566
|
29,223
|
29,222
|
29,222
|
29,222
|
29,222
|
29,222
|
|
551026270800. CBD rubbish bin collection
|
158,265
|
158,265
|
158,265
|
158,265
|
168,892
|
168,891
|
168,891
|
168,891
|
168,891
|
168,891
|
|
55102637. Insurance
|
1,077
|
1,077
|
1,077
|
1,077
|
1,077
|
1,077
|
1,077
|
1,077
|
1,077
|
1,077
|
|
55102650. Security / Cash Collections
|
40,000
|
40,000
|
40,000
|
40,000
|
40,000
|
40,000
|
40,000
|
40,000
|
40,000
|
40,000
|
|
Base Consultants
|
9,385
|
9,385
|
9,385
|
9,385
|
9,385
|
9,385
|
9,385
|
9,385
|
9,385
|
9,385
|
|
55102710. Legal Fees
|
5,000
|
5,000
|
5,000
|
5,000
|
5,000
|
5,000
|
5,000
|
5,000
|
5,000
|
5,000
|
|
55102720. Valuations
|
4,385
|
4,385
|
4,385
|
4,385
|
4,385
|
4,385
|
4,385
|
4,385
|
4,385
|
4,385
|
|
Programmed Expenses
|
115,000
|
10,000
|
15,000
|
50,000
|
10,000
|
15,000
|
70,000
|
90,000
|
15,000
|
50,000
|
|
Programmed Service Provision
|
65,000
|
0
|
5,000
|
0
|
0
|
5,000
|
0
|
0
|
5,000
|
0
|
|
55104312. Grant: Christmas Tree Decorations
|
0
|
0
|
5,000
|
0
|
0
|
5,000
|
0
|
0
|
5,000
|
0
|
|
551043120707. Grant: Bank Lane Canopy
|
65,000
|
0
|
0
|
0
|
0
|
0
|
0
|
0
|
0
|
0
|
|
Programmed Consultants
|
50,000
|
10,000
|
10,000
|
50,000
|
10,000
|
10,000
|
70,000
|
90,000
|
10,000
|
50,000
|
|
551047302518. Parking Strategy
|
0
|
0
|
0
|
0
|
0
|
0
|
20,000
|
80,000
|
0
|
0
|
|
55104760. Parking Surveys
|
50,000
|
10,000
|
10,000
|
50,000
|
10,000
|
10,000
|
50,000
|
10,000
|
10,000
|
50,000
|
|
Renewals
|
290,368
|
140,368
|
671,400
|
490,368
|
20,368
|
20,368
|
20,368
|
110,368
|
20,368
|
20,368
|
|
Renewals General
|
0
|
0
|
560,000
|
470,000
|
0
|
0
|
0
|
90,000
|
0
|
0
|
|
551071401484. Renewals: On and Off St Parking Meter
|
0
|
0
|
470,000
|
470,000
|
0
|
0
|
0
|
0
|
0
|
0
|
|
551071402942. Renewal: CCTV
|
0
|
0
|
90,000
|
0
|
0
|
0
|
0
|
90,000
|
0
|
0
|
|
Renewals: Other Property Improvements
|
290,368
|
140,368
|
111,400
|
20,368
|
20,368
|
20,368
|
20,368
|
20,368
|
20,368
|
20,368
|
|
551072252207. Renewal CBD Rubbish Bins
|
5,368
|
5,368
|
96,400
|
5,368
|
5,368
|
5,368
|
5,368
|
5,368
|
5,368
|
5,368
|
|
551072552518. Parking Strategy implementation unspecified
|
270,000
|
120,000
|
0
|
0
|
0
|
0
|
0
|
0
|
0
|
0
|
|
551072552943. Carpark Street Light Renewal
|
15,000
|
15,000
|
15,000
|
15,000
|
15,000
|
15,000
|
15,000
|
15,000
|
15,000
|
15,000
|
|
Capital Increased LOS
|
227,000
|
355,000
|
250,000
|
400,000
|
500,000
|
0
|
0
|
0
|
0
|
0
|
|
Capital Increased LOS: Infrastructure
|
227,000
|
355,000
|
250,000
|
400,000
|
500,000
|
0
|
0
|
0
|
0
|
0
|
|
551079551840. Capital: Bridge St enhancement
|
132,000
|
0
|
0
|
0
|
0
|
0
|
0
|
0
|
0
|
0
|
|
551079552994. Strawbridge Sq Layout & access improvement
|
45,000
|
15,000
|
0
|
0
|
0
|
0
|
0
|
0
|
0
|
0
|
|
551079552995. Putaitai St/ Main Rd Stoke Right turn
|
0
|
40,000
|
0
|
0
|
0
|
0
|
0
|
0
|
0
|
0
|
|
551079553000. CBD Enhancements
|
50,000
|
250,000
|
250,000
|
300,000
|
0
|
0
|
0
|
0
|
0
|
0
|
|
551079752984. Stoke CBD enhancements
|
0
|
50,000
|
0
|
100,000
|
500,000
|
0
|
0
|
0
|
0
|
0
|
|
5560 Public
Transport
|
991,821
|
1,063,293
|
976,902
|
1,048,340
|
1,408,879
|
1,250,052
|
1,061,898
|
1,074,449
|
1,087,759
|
1,151,865
|
|
Base Expenditure
|
922,473
|
931,424
|
940,872
|
992,310
|
1,002,850
|
1,014,022
|
1,025,868
|
1,038,419
|
1,051,729
|
1,065,835
|
|
Base Service Provision Council Wide
|
877,473
|
886,378
|
895,850
|
947,310
|
957,850
|
969,022
|
980,868
|
993,419
|
1,006,729
|
1,020,835
|
|
556023100391. Bus Services: 511 Subsidised
|
538,973
|
539,018
|
539,047
|
520,635
|
520,635
|
520,634
|
520,636
|
520,634
|
520,636
|
520,637
|
|
556023102321. WC 514 Public Transport Facilities Ops
|
20,000
|
20,031
|
20,031
|
80,000
|
80,000
|
80,000
|
80,000
|
80,000
|
80,000
|
80,000
|
|
556023102335. PT Minor Improvements Opex
|
171,000
|
171,000
|
171,000
|
171,000
|
171,000
|
171,000
|
171,000
|
171,000
|
171,000
|
171,000
|
|
55602322. WC 522 SuperGold Card Concessions
|
147,500
|
156,329
|
165,772
|
175,675
|
186,215
|
197,388
|
209,232
|
221,785
|
235,093
|
249,198
|
|
Base General Operating Expense
|
45,000
|
45,046
|
45,022
|
45,000
|
45,000
|
45,000
|
45,000
|
45,000
|
45,000
|
45,000
|
|
556026452321. WC 524 PT Info Supply
|
45,000
|
45,046
|
45,022
|
45,000
|
45,000
|
45,000
|
45,000
|
45,000
|
45,000
|
45,000
|
|
Programmed Expenses
|
0
|
0
|
0
|
0
|
50,000
|
0
|
0
|
0
|
0
|
50,000
|
|
Programmed Service Provision
|
0
|
0
|
0
|
0
|
50,000
|
0
|
0
|
0
|
0
|
50,000
|
|
556043222510. Passenger Transport service review
|
0
|
0
|
0
|
0
|
50,000
|
0
|
0
|
0
|
0
|
50,000
|
|
Capital Growth
|
33,318
|
95,839
|
0
|
20,000
|
320,000
|
200,000
|
0
|
0
|
0
|
0
|
|
Capital Growth: Other Property Improvements
|
33,318
|
95,839
|
0
|
20,000
|
320,000
|
200,000
|
0
|
0
|
0
|
0
|
|
556075902218. Stoke interchange (WC531)
|
0
|
0
|
0
|
20,000
|
300,000
|
0
|
0
|
0
|
0
|
0
|
|
556075902945. Integrated Ticketing (WC531)
|
33,318
|
95,839
|
0
|
0
|
0
|
0
|
0
|
0
|
0
|
0
|
|
556075902997. CBD interchange
|
0
|
0
|
0
|
0
|
20,000
|
200,000
|
0
|
0
|
0
|
0
|
|
Capital Increased LOS
|
36,030
|
36,030
|
36,030
|
36,030
|
36,029
|
36,030
|
36,030
|
36,030
|
36,030
|
36,030
|
|
Capital Increased LOS: Infrastructure
|
36,030
|
36,030
|
36,030
|
36,030
|
36,029
|
36,030
|
36,030
|
36,030
|
36,030
|
36,030
|
|
556079902335. PT Minor Improvements
|
36,030
|
36,030
|
36,030
|
36,030
|
36,029
|
36,030
|
36,030
|
36,030
|
36,030
|
36,030
|
|
5570 Total
Mobility
|
380,236
|
359,935
|
400,998
|
399,770
|
420,794
|
500,425
|
461,469
|
480,512
|
500,481
|
517,142
|
|
Base Expenditure
|
380,236
|
359,935
|
400,998
|
399,770
|
420,794
|
500,425
|
461,469
|
480,512
|
500,481
|
517,142
|
|
Base Service Provision Council Wide
|
380,236
|
359,935
|
400,998
|
399,770
|
420,794
|
500,425
|
461,469
|
480,512
|
500,481
|
517,142
|
|
557023100460. WC 517 Total Mobility Operations
|
274,736
|
290,260
|
306,718
|
321,760
|
338,103
|
352,773
|
368,557
|
382,026
|
396,086
|
406,483
|
|
557023220455. Wheelchair replacement 519
|
40,000
|
0
|
20,011
|
0
|
0
|
60,000
|
0
|
0
|
0
|
0
|
|
557023220801. Wheelchair hoist use (WC521)
|
65,500
|
69,675
|
74,269
|
78,010
|
82,691
|
87,652
|
92,912
|
98,486
|
104,395
|
110,659
|
Appendix M minor
improvement and footpaths Priority List
|
Minor
Improvements Projects
|
|
|
|
|
Original
description
|
Road
|
Location
|
Comments
|
Construction
estimate
|
|
Maori Road retaining
wall
|
Maori Road
|
|
Retaining
wall is failing and needs immediate attention.
|
$300,000
|
|
Homezone Area
project
|
|
|
Prioritised
based on Homezone spreadsheet.
|
$100,000pa
|
|
Waimea
Road/The Ridgeway - Safety improvements
|
Waimea
Road/The Ridgeway
|
Intersection
of Waimea Road and The Ridgeway
|
Tighten the
radius of the kerb for vehicles turning left into The Ridgeway to reduce
speeds. Relies on the speed limit being reduced to 50km/h on Waimea Road.
|
$200,000
|
|
Poleford
Bridge Seismic Upgrade
|
Maitai Valley
Road
|
Poleford
Bridge
|
Life Line
route to water supply with bridge with poor seismic and HPMV capacity
|
$35,000
|
|
Gibbs Bridge
Seismic Upgrade
|
Maitai Valley
Road
|
Gibbs Bridge
|
Life Line
route to water supply with bridge with poor seismic and HPMV capacity
|
$60,000
|
|
Airport
Bridge Replacement
|
|
Coastal
Shared Path
|
Existing
bridge reached end of serviceable life. Piles and main span decayed
|
$230,000
|
|
Neale Ave -
Parking and safety improvements
|
Neale Avenue
|
Neale Ave
adjacent to Neale Park
|
Parents park
on Neale Ave at the back of Nayland School to pick up and drop off children,
but speeding vehicles. Angle parking and traffic calming on the approaches
are options.
|
$50,000
|
|
Atawhai
Crescent - Bus stop relocation
|
Atawhai
Crescent
|
Atawhai
Crescent and intersections with Dodson Valley Road and Rainbow Drive
|
Bus stop has
been relocated but pedestrian refuge/build outs still need to be designed and
constructed to allow safer pedestrian access from all footpath approaches.
|
$50,000
|
|
Toi Toi
Street/St Vincent Street safety improvements
|
Toi Toi
Street/St Vincent Street intersection
|
Toi Toi
Street/St Vincent Street intersection
|
High number
of crashes at this intersection. Partially due to unbalanced sight distances.
Need to improve pedestrian safety so allow for raised pedestrian tables on
all four approaches.
|
$300,000
|
|
Wigzell Area
wide traffic calming
|
Kawai Street
South
|
All of Kawai
Street South
|
re
Neighbourhood Support letter, investigate. Has been transferred to
Homezone/shared zone/traffic calming programme for area wide treatment.
|
$300,000
|
|
Alton St -
Streetlights
|
Alton Street
|
Alton Street
for 100m south of Hardy Street adjacent to planted central median
|
Very dark in
places. Ped safety issue
|
$20,000
|
|
Strawbridge
Square Car Park- Footpath narrowing
|
Strawbridge
Carpark
|
|
Driveway from
Songer Street is very narrow. Cost depends on solution chosen. At lower end
remarking and signing the driveway for exit only would solve the issue.
|
$50,000
|
|
Polstead Rd -
Pedestrian refuge
|
Polstead Road
|
Polstead
Road/Nikau Street Intersection
|
By the shops.
Safe Journey to School, project in 2011/12. Couldn't get agreement to
project.
|
$70,000
|
|
Grove St
|
Grove Street
|
Between
Collingwood Street and Tasman Street
|
Long straight
section with few cars parked encourages higher speeds. Kindergarten on this
section. Allows for build-outs or chicane.
|
$20,000
|
|
State Highway
6 Pedestrian Crossing - Muritai Street
|
State Highway
6
|
North of
Muritai Street
|
Difficult to
for pedestrians to cross without a walking to the traffic signals. Central
pedestrian refuge and kerb build-outs proposed.
|
$200,000
|
|
Trafalgar St
South - Footpath and kerb repairs
|
Trafalgar
Street South
|
Trafalgar
Street South adjacent to Nelson Girls High
|
Safety
improvements - fix footpath / low kerb by roundabout. Need to lift f/p and
retain etc -cycle accident 3/09
|
$90,000
|
|
The
Ridgeway/Arapiki Road - Pedestrian safety improvements
|
The
Ridgeway/Arapiki Road
|
Intersection
of Arapiki Road and The Ridgway
|
Children
coming down Arapiki to cross Ridgeway have poor sightlines to north. Tighten
left turn radius, construct pedestrian build-outs.
|
$50,000
|
|
Marsden
Valley/The Ridgeway Intersection Upgrade
|
Marsden
Valley/The Ridgeway intersection
|
Marsden
Valley/The Ridgeway intersection
|
Sight distances
are inadequate in at this intersection. Allows for minor kerb changes and
calming to reduce speeds to match visibility.
|
$75,000
|
|
Vanguard
Street - Right-turn bay safety improvements
|
Vanguard
Street
|
Vanguard
Street between Toi Toi Street and North Esk Street
|
Improve
safety at the Vanguard / Toitoi intersection. The safety record of this
intersection has improved since the change in give way rule so uncertain
whether any further work is necessary.
|
$300,000
|
|
Quebec Rd -
Speed reduction
|
Quebec Road
|
Quebec Road
for 600m east of Prince Drive
|
Traffic
calming required along straight connecting to Princes Dr. Straight section is
out of character with the remainder of Quebec Road. Traffic calming will
reduce speeds on this section to be similar to the rest of the route.
|
$50,000
|
|
Shakespeare
Walk/Bridge
|
Shakespeare
Walk
|
|
Pedestrian
conflict - To be mitigated with pedestrian buildouts on both sides of the
road.
|
$100,000
|
|
Karaka St -
Traffic calming
|
Karaka Street
|
Karaka Street
north of Orchard Street
|
Traffic
calming by Council flats. Some has been done already but 200m between
build-outs so an additional build-out needed.
|
$20,000
|
|
Examiner St -
Speed humps
|
Examiner
Street
|
Examiner
Street 30m west of Trafalgar Street South
|
Speed humps
too severe. They are likely to be achieving the objective of slowing vehicles
down. The profile of the humps complies with the relevant design guidelines.
|
$10,000
|
|
Annesbrook
Drive by Black Cat dairy with road remark
|
Annesbrook
Drive
|
|
Opportunity
to provide ped refuges adjacent to the Black Cat Dairy.
|
$100,000
|
|
Nile
Street/Maitai Valley Road intersection upgrade
|
Nile
Street/Maitai Valley Road intersection
|
Nile
Street/Maitai Valley Road intersection
|
Poor safety
record at this intersection caused by limited visibility and poor alignment.
Allows for minor kerb changes and calming to reduce speeds and improve stop
position.
|
$100,000
|
|
Arrow
St/Quebec St intersection - Safety improvements
|
Arrow
Street/Quebec Road
|
Intersection
of Arrow Street and Quebec Road
|
Small flush
roundabout to allow for safer right turn movements from down hill approach of
Arrow Street.
|
$30,000
|
|
Vanguard St -
Protection of shared path from parked cars
|
Vanguard
Street
|
|
Need some
sort of protection to prevent vehicles parking on Shared path. This is an
enforcement issue.
|
$70,000
|
|
Stafford
Ave/Annesbrook Drive one way section
|
Stafford
Avenue
|
|
AJ worked
with residents to agree a plan in 2012. Allows for minor changes to marking
and islands to make turning in difficult from Main Road Stoke.
|
$30,000
|
|
Marybank Road
- Roundabout improvements
|
Marybank Road
|
Intersection
of Marybank Road and Noel Jones Drive
|
WALTER Ingram
S/R 108823 (Larger trucks will struggle to track through intersection but
this is uncommon and only really during construction. Tresillian Ave will be
connected through in the next couple of years so an alternative route will be
available.)
|
$30,000
|
|
Near misses
with cyclists driving out of Marsden Cemetery
|
Marsden
Valley Road
|
|
Conflict
between cyclists on path and cars exiting cemetery driveway. Road marking and
signage to inform drivers of cycle activity.
|
$50,000
|
|
NETWORK DEFICIENCIES - FOOTPATHS
|
|
|
|
|
Original description
|
Road/Walkway Name
|
Location
|
Notes
|
Construction estimate
|
|
Footpath in front of 413 Waimea Road
|
Waimea Road
|
Between Chings Road and The Ridgeway - South side
|
Evidence of high use by school children.
|
$ 33,750.00
|
|
Songer Street footpath, south side west of Nayland Rd
360m
|
Songer Street
|
Between Nayland Road and Durham Street - South side
|
Some levels issues, driveway, gardens on road
reserve.
|
$ 85,500.00
|
|
Bronte Street footpath behind St Joseph's
|
Bronte Street
|
Between Scotland Street and Collingwood Street
|
No footpath along the back of St Josephs School.
Trees and bank make construction more expensive.
|
$ 72,000.00
|
|
Centennial Road footpath
|
Centennial Road
|
Full length on south side.
|
Gap in footpath on south side, popular with school
children.
|
$ 45,000.00
|
|
Kea Street footpath
|
Kea Street
|
Full length on north side.
|
Tracks on grass show desire lines, crossings at
intersection with Kaka St lead you nowhere, just into middle of intersection
|
$ 29,250.00
|
|
Nikau Street footpath
|
Nikau Street
|
Full length on south side.
|
Full length to provide higher level of service for
pedestrians accessing back of school in particular.
|
$ 69,750.00
|
|
Palm Avenue footpath
|
Palm Avenue
|
|
Between Nikau Street and Apple Lane.
|
$ 20,250.00
|
|
Manson Avenue footpath
|
Manson Avenue
|
|
Full length. Close to school.
|
$ 110,250.00
|
|
Stanley Crescent footpath
|
Stanley Crescent
|
From Beachville Crescent to end - South side
|
Some visibility issues over crests.
|
$ 108,000.00
|
|
Emano Street footpath (Lower section)
|
Emano Street
|
Piko Street to Orsman Crescent
|
Footpath on one side only. High proportion of
children in the area walk to school.
|
$ 222,000.00
|
|
Emano Street (Upper section)
|
Emano Street
|
Orsman Crescent to end
|
No footpath. Part of walkway to the top of port
hills.
|
$ 192,000.00
|
|
Arapiki Road footpath
|
Arapiki Road
|
South side west of crest
|
80m of footpath between No 24 and 32, south side to
improve schoolchildren visibility to cross Arapiki Rd, avoids crossing at toe
of hill(poor visibility) or at Ridgeway/Arapiki.
|
$ 64,000.00
|
|
Scotia Street footpath
|
Scotia Street
|
Anglia Street to 140m north
|
Visibility around corner difficult, new house on
corner will complicate lack of footpath.
|
$ 168,000.00
|
|
Maire Street Footpath
|
Marie Street
|
50m at end
|
Involves sale of land. Links end of existing footpath
to walkway at end of road.
|
$ 40,000.00
|
|
Maitai Path
|
Maitai Path
|
Adjacent to Whakatu land
|
Length of Maitai path to be upgraded once Whakatu
redevelop the site at 16 Paru Paru Road. Agreements in place to allow
widening once they establish café outdoor area on neighbouring park.
|
$ 35,000.00
|
|
Brougham Street footpath
|
Brougham Street
|
East of Collingwood Street
|
Footpath is missing on southern side. Very difficult
to construct as all driveways would need to be regraded for a long way back
into properties. No opportunity to join to the Scotland Street footpath as
road gets too close to boundary.
|
$ 300,000.00
|
|
Dodson Valley Road footpath
|
Dodson Valley Road
|
South side between Winton Place and Atawhai Crescent
|
Hill in the way. Not feasible to provide footpath on
this side of the road and still provide access to properties. Have added
pedestrian build-outs to minor improvements list instead.
|
$ 372,000.00
|
|
Bledisloe Avenue footpath
|
Bledisloe Avenue
|
In front of numbers 2-16
|
Missing section in front of 2-16 leads to Bledisloe
Reserve.
|
$ 29,250.00
|
|
Reeves Street footpath
|
Reeves Street
|
West side for 70 m north of Aldinga Avenue
|
Restricted visibility when crossing at end of
footpath on north side.
|
$ 35,000.00
|
|
Montreal Road footpath
|
Montreal Road
|
South of Toi Toi Street
|
Footpath on one side only.
|
$ 252,000.00
|
|
Joyce Place footpath
|
Joyce Place
|
Full length
|
Footpath on one side only. Is a new subdivision and
in a short cul-de-sac so not a priority.
|
$ 36,000.00
|
|
Washington Road footpath
|
Washington Road
|
East of Brittania Heights intersection
|
No footpath on residential side of road, 4 houses
affected, steep bank and tight road alignment. Children have to cross road to
reach footpath at bottom of bank. No feasible option for providing a footpath
on the west side of the road and still being able to provide vehicle access
to the properties affected.
|
$ 192,000.00
|
|
Rangiora Terrace footpath
|
Rangiora Terrace
|
Between end of existing footpath and Tamaki Steps
|
Rough surface from base of steps onto existing
footpath, No footpath around Rangiora Tce intersection and over rise towards
sea. Too dangerous and have to cross road. Rangiora Tce upgrade no longer in
AMP. Rough surface to be dealt with by maintenance.
|
$ 12,000.00
|
|
The Ridgeway footpath
|
The Ridgeway
|
From Somerset Tce towards Kauri St on the east side
|
Footpath is in poor repair, when repaired can it be
moved 1 metre back from traffic lanes, peds are very close to moving traffic
lanes.
|
$ 210,000.00
|
|
Jellicoe Ave footpath
|
Jellicoe Avenue
|
Bledsloe Ave to Railway Reserve
|
Well worn path from Bledsloe Ave to Railway Reserve.
|
$ 27,000.00
|
|
Airlie Street footpath
|
Airlie Street
|
Full length
|
No footpath.
|
$ 336,000.00
|
|
Bridge on approach to the Airport/Quarantine Rd
|
Quarantine Road
|
|
Bridge on approach to Quarantine Rd/Bolt Rd
roundabout on Quarantine has no footpath on south side. Some pedestrians to
airport and general walkers.
|
$ 200,000.00
|
|
Douglas Rd to Observatory Hill walkway
|
Off Road
|
Off Road
|
Off road recreational route. Needs to be part of any
development of the land above Douglas Road. Over private property.
|
$ 600,000.00
|
|
Observatory Hill to Emano St walkway
|
Off Road
|
Off Road
|
Off road recreational route. Needs to be part of any
development of the land above Emano Street. Over private property.
|
$ 270,000.00
|
|
Stanley Crescent to Washington Rd walkway
|
Off Road
|
Off Road
|
Off road recreational and transport route. Over
private property.
|
$ 240,000.00
|
Appendix N Footpath
Rehabilitation Sites
Proposed
Footpath Rehabilitation sites - Draft Treatment Selection 2015/2018
|
Road Name
|
Start
|
End
|
Carriageway Start Name
|
Carriageway End Name
|
Side
|
Length
|
|
Year 1
|
|
|
|
|
|
|
|
BRIDGE STREET
|
7
|
48
|
RUTHERFORD STREET
|
TRAFALGAR STREET
|
LEFT
|
41
|
|
TASMAN STREET SOUTH
|
36
|
134
|
BRIDGE STREET
|
HARDY STREET
|
LEFT
|
98
|
|
NILE STREET EAST
|
|
|
SUSSEX STREET
|
COLLINGWOOD STREET
|
LEFT
|
80
|
|
TIPAHI STREET
|
470
|
500
|
FRANKLYN STREET
|
MOTUEKA STREET
|
LEFT
|
30
|
|
MARSDEN VALLEY ROAD
|
10
|
400
|
MAIN ROAD STOKE
|
TAUPATA STREET
|
LEFT
|
390
|
|
ANNESBROOK DRIVE
|
|
|
NO. 312 ANNESBROOK DRIVE
|
QUARANTINE ROAD
|
RIGHT
|
50
|
|
UFB COST SHARE SITES
|
|
|
VARIOUS
|
|
|
|
|
YEAR 2
|
|
|
|
|
|
|
|
MAIN ROAD STOKE
|
316
|
336
|
LOUISSON AVENUE
|
MAITLAND AVENUE
|
Left
|
20
|
|
MAIN ROAD STOKE
|
715
|
895
|
MARSDEN ROAD
|
ROAD WIDENS
|
Left
|
180
|
|
MOTUEKA STREET
|
287
|
297
|
TIPAHI STREET
|
WAIMEA ROAD
|
Right
|
10
|
|
VICKERMAN STREET
|
141
|
153
|
HAVEN RD
|
WILDMAN AVE
|
Right
|
12
|
|
WILDMAN AVENUE (EASTBOUND)
|
353
|
373
|
VICKERMAN STREET
|
LOW STREET
|
Right
|
20
|
|
BRIDGE STREET
|
863
|
873
|
HARLEY STREET
|
TASMAN ST BRIDGE
|
Right
|
10
|
|
BRIDGE STREET
|
262
|
505
|
TRAFALGAR ST
|
COLLINGWOOD STREET
|
Right
|
243
|
|
BRIDGE STREET
|
262
|
502
|
TRAFALGAR ST
|
COLLINGWOOD STREET
|
Left
|
240
|
|
CAR PARK MONTGOMERY SQUARE
|
286
|
359
|
ACCESS NW CORNER BY ROLLOS
|
RUTHERFORD ST KERB LINE
|
Left
|
73
|
|
CAR PARK MONTGOMERY SQUARE
|
50
|
168
|
EAST SIDE OF CARPARK (WHITCOULLS)
|
WEST SIDE OF CARPARK (RSA)
|
Right
|
118
|
|
CAR PARK MONTGOMERY SQUARE
|
168
|
286
|
WEST SIDE OF CARPARK (RSA)
|
WEST SDIE OF NOTHERN HALF CARPARK
|
Right
|
118
|
|
COLLINGWOOD STREET
|
1342
|
1407
|
NILE STREET
|
BRONTE STREET
|
Left
|
65
|
|
DURHAM STREET
|
5
|
100
|
SONGER ST
|
RUTLAND ST
|
Left
|
95
|
|
EXAMINER STREET
|
350
|
371
|
RUTHERFORD STREET
|
TRAFALGAR STREET
|
Left
|
21
|
|
EXAMINER STREET
|
176
|
225
|
RUTHERFORD STREET
|
TRAFALGAR STREET
|
Right
|
49
|
|
FRANKLYN STREET
|
300
|
320
|
TIPAHI ST
|
KAWAI ST
|
Left
|
20
|
|
FRANKLYN STREET
|
552
|
622
|
WAIMEA RD
|
END AT JUDDER BAR
|
Right
|
70
|
|
HALIFAX STREET
|
213
|
310
|
RUTHERFORD ST
|
TRAFALGAR ST
|
Left
|
97
|
|
YEAR 3
|
|
|
|
|
|
|
|
HALSTEAD STREET
|
7
|
42
|
HALIFAX ST
|
NEW ST
|
Left
|
35
|
|
HAVEN ROAD (ARTERIAL, NORTHBOUND)
|
194
|
264
|
HALIFAX STREET
|
QUEEN ELIZABETH II DRIVE
|
Left
|
70
|
|
HAVEN ROAD (ARTERIAL, NORTHBOUND)
|
72
|
177
|
HALIFAX STREET
|
QUEEN ELIZABETH II DRIVE
|
Left
|
105
|
|
HAVEN ROAD (ARTERIAL, NORTHBOUND)
|
267
|
391
|
HALIFAX STREET
|
QUEEN ELIZABETH II DRIVE
|
Left
|
124
|
|
MAIN ROAD STOKE
|
627
|
637
|
MAITLAND AVENUE
|
KEA STREET
|
Left
|
10
|
|
MAIN ROAD STOKE
|
637
|
681
|
KEA STREET
|
MARSDEN ROAD
|
Left
|
44
|
|
MAIN ROAD STOKE
|
1629
|
1688
|
LEMARI AVENUE
|
TAINUI STREET
|
Left
|
59
|
|
MAIN ROAD STOKE
|
1071
|
1170
|
PUTAITAI STREET
|
SONGER STREET
|
Left
|
99
|
|
MAIN ROAD STOKE
|
1509
|
1629
|
RANUI STREET
|
LEMARI AVENUE
|
Left
|
120
|
|
MAIN ROAD STOKE
|
4200
|
4505
|
ELMS STREET
|
SALISBURY ROAD
|
Left
|
305
|
|
SCOTLAND STREET
|
4
|
64
|
BRONTE STREET
|
SEYMOUR AVENUE
|
Right
|
60
|
|
SEAVIEW ROAD
|
176
|
186
|
ALLPORT PLACE
|
SEAVIEW LOOP ROAD
|
Left
|
10
|
|
SHELBOURNE STREET
|
98
|
112
|
NILE ST
|
EDUCATION BUILDING
|
Right
|
14
|
|
SONGER STREET
|
620
|
635
|
DERBY STREET
|
REEVES STREET
|
Left
|
15
|
|
SONGER STREET
|
410
|
435
|
SEAVIEW ROAD
|
DURHAM STREET
|
Left
|
25
|
|
THE RIDGEWAY (NORTH)
|
290
|
300
|
ROAD NARROWS
|
BAIGENT ROAD
|
Left
|
10
|
|
TRAFALGAR SQUARE (WEST SIDE)
|
87
|
97
|
ROAD NARROWS
|
NILE STREET WEST
|
Right
|
10
|
|
TRAFALGAR SQUARE (WEST SIDE)
|
55
|
68
|
ROAD NARROWS
|
NILE STREET WEST
|
Left
|
13
|
|
TRAFALGAR SQUARE (WEST SIDE)
|
108
|
312
|
NILE STREET WEST
|
TRAFALGAR STREET ROUNDABOUT (EXAMIN
|
Left
|
204
|
|
TRAFALGAR STREET (NORTH)
|
286
|
340
|
ROAD WIDENS
|
GROVE STREET
|
Left
|
54
|
|
TRAFALGAR STREET (NORTH)
|
759
|
814
|
HALIFAX STREET
|
BRIDGE ST
|
Right
|
55
|
|
TRAFALGAR STREET (NORTH)
|
726
|
814
|
HALIFAX STREET
|
BRIDGE ST
|
Left
|
88
|
|
YEAR 4 AND BEYOND
|
|
|
|
|
|
|
|
TRAFALGAR STREET (SOUTH)
|
219
|
246
|
ROAD WIDENS
|
BRONTE STREET (CENTRAL)
|
Left
|
27
|
|
TRAFALGAR STREET (SOUTH)
|
248
|
298
|
ROAD WIDENS
|
BRONTE STREET (CENTRAL)
|
Left
|
50
|
|
TRAFALGAR STREET (SOUTH)
|
162
|
217
|
ROAD WIDENS
|
BRONTE STREET (CENTRAL)
|
Left
|
55
|
|
TRAFALGAR STREET (SOUTH)
|
91
|
162
|
EXAMINER STREET
|
ROAD WIDENS
|
Left
|
71
|
|
VAN DIEMEN STREET
|
395
|
410
|
RUTHERFORD ST
|
TRAFALGAR ST
|
Right
|
15
|
|
VANGUARD STREET
|
29
|
39
|
RUTHERFORD STREET
|
HARDY STREET
|
Left
|
10
|
|
VANGUARD STREET
|
1987
|
2004
|
MOTUEKA STREET
|
END
|
Right
|
17
|
|
WAIMEA ROAD
|
1200
|
1215
|
FRANKLYN STREET
|
MOTUEKA STREET
|
Left
|
15
|
|
WAIMEA ROAD
|
478
|
490
|
VAN DIEMAN STREET
|
HAMPDEN STREET
|
Left
|
12
|
|
WAIMEA ROAD
|
4670
|
4708
|
QUARANTINE ROAD
|
ANNESBROOK DRIVE CENTRE ISLAND
|
Left
|
38
|
|
ANNESBROOK DRIVE
|
344
|
476
|
QUARANTINE ROAD EAST
|
MAPLE AVENUE
|
Left
|
132
|
|
BRONTE STREET (EAST)
|
0
|
63
|
CDS
|
BROOK ST
|
Left
|
63
|
|
CHAMBERLAIN STREET
|
207
|
219
|
RANGIORA
|
MAIRE ST
|
Right
|
12
|
|
CHAMBERLAIN STREET
|
109
|
152
|
TOSWILL ST
|
RANGIORA
|
Right
|
43
|
|
GREEN STREET
|
249
|
327
|
MURITAI ST
|
ROTO ST
|
Left
|
78
|
|
KONINI STREET
|
424
|
476
|
MOUNT ST
|
GLOUCESTER ST
|
Left
|
52
|
|
MAITLAND AVENUE
|
225
|
235
|
MAIN RD STOKE
|
KOROMIKO AVE
|
Right
|
10
|
|
MOTUEKA STREET
|
143
|
153
|
VANGUARD STREET
|
TIPAHI STREET
|
Right
|
10
|
|
MOTUEKA STREET
|
20
|
42
|
VANGUARD STREET
|
TIPAHI STREET
|
Right
|
22
|
|
NEALE AVENUE
|
95
|
115
|
BLEDISLOE AVE
|
KEA ST
|
Left
|
20
|
|
NGATITAMA STREET
|
35
|
45
|
RUTHERFORD ST
|
HAMPDEN ST
|
Right
|
10
|
|
NORTH ROAD
|
198
|
208
|
WEKA ST
|
START KERB LHS
|
Left
|
10
|
|
NORTH ROAD
|
453
|
463
|
START KERB LHS
|
END
|
Left
|
10
|
|
PARKERS ROAD
|
250
|
270
|
BULLEN STREET
|
MURITAI STREET
|
Left
|
20
|
|
PARKERS ROAD
|
850
|
930
|
OTTERSON STREET
|
GOLF ROAD
|
Left
|
80
|
|
PARKERS ROAD
|
725
|
806
|
PARKERS ROAD ROUNDABOUT (BOLT)
|
OTTERSON STREET
|
Left
|
81
|
|
QUARANTINE ROAD
|
505
|
515
|
BOLT ROAD
|
PASCOE STREET
|
Left
|
10
|
|
QUARANTINE ROAD
|
86
|
145
|
BOLT ROAD
|
PASCOE STREET
|
Left
|
59
|
|
SCOTLAND STREET
|
64
|
189
|
SEYMOUR AVENUE
|
BROUGHAM STREET
|
Right
|
125
|
|
SUFFOLK ROAD
|
490
|
502
|
KINGSFORD DRIVE
|
CLAIRMONT HEIGHTS
|
Left
|
12
|
|
SUFFOLK ROAD
|
815
|
957
|
KINGSFORD DRIVE
|
CLAIRMONT HEIGHTS
|
Left
|
142
|
|
THE RIDGEWAY (SOUTH)
|
520
|
560
|
KAURI STREET
|
SOMERSET TERRACE
|
Left
|
40
|
|
THE RIDGEWAY (SOUTH)
|
408
|
453
|
KAURI STREET
|
SOMERSET TERRACE
|
Left
|
45
|
|
THE RIDGEWAY (SOUTH)
|
620
|
680
|
KAURI STREET
|
SOMERSET TERRACE
|
Left
|
60
|
|
TRAFALGAR SQUARE (CUL DE SAC)
|
3
|
91
|
TRAFALGAR SQ (WEST SIDE)
|
END
|
Right
|
88
|
|
WAIMEA ROAD
|
4709
|
4784
|
QUARANTINE ROAD
|
ANNESBROOK DRIVE CENTRE ISLAND
|
Left
|
75
|
|
WASTNEY TERRACE
|
265
|
275
|
JACKSON ST
|
JOLLIE ST
|
Right
|
10
|
|
WESTBROOK TERRACE
|
56
|
218
|
SEYMOUR AVE
|
MIRO ST
|
Right
|
162
|
|
|
UFB YET TO BE INSTALLED *
|
|
BEACH ROAD
|
170
|
180
|
BISLEY WALK
|
WAIKARE STREET
|
Left
|
10
|
|
FRANKLYN STREET
|
40
|
68
|
VANGUARD ST
|
TIPAHI ST
|
Left
|
28
|
|
FRANKLYN STREET
|
110
|
130
|
VANGUARD ST
|
TIPAHI ST
|
Left
|
20
|
|
TUKUKA STREET
|
314
|
324
|
KAWAI ST
|
WAIMEA RD
|
Right
|
10
|
|
TUKUKA STREET
|
197
|
212
|
TIPAHI ST
|
KAWAI ST
|
Right
|
15
|
|
TUKUKA STREET
|
269
|
369
|
KAWAI ST
|
WAIMEA RD
|
Left
|
100
|
|
BAIGENT ROAD
|
50
|
120
|
THE RIDGEWAY
|
NEWMAN DR
|
Left
|
70
|
|
EMANO STREET
|
590
|
620
|
MURPHY ST
|
ORSMAN CRESENT
|
Left
|
30
|
|
JENNER ROAD
|
440
|
465
|
JENNER ROAD CUL-DE-SAC 1
|
JENNER ROAD CUL-DE-SAC 2
|
Left
|
25
|
|
JENNER ROAD
|
345
|
400
|
JENNER ROAD CUL-DE-SAC 1
|
JENNER ROAD CUL-DE-SAC 2
|
Left
|
55
|
|
KARAKA STREET
|
0
|
10
|
TITOKI ST
|
POLSTEAD RD
|
Right
|
10
|
|
KARAKA STREET
|
62
|
72
|
TITOKI ST
|
POLSTEAD RD
|
Right
|
10
|
|
KARAKA STREET
|
72
|
97
|
TITOKI ST
|
POLSTEAD RD
|
Left
|
25
|
|
MARSDEN ROAD
|
168
|
277
|
MAIN RD STOKE
|
THE RIDGEWAY
|
Left
|
109
|
|
MARSDEN ROAD
|
7
|
159
|
MAIN RD STOKE
|
THE RIDGEWAY
|
Left
|
152
|
|
NILE STREET (EAST)
|
1363
|
1383
|
MAITAI RD
|
CLEVELAND TCE
|
Right
|
20
|
|
SCOTIA STREET
|
815
|
825
|
ANGLIA STREET
|
BEATSON ROAD (SOUTH END)
|
Left
|
10
|
|
SCOTIA STREET
|
884
|
895
|
ANGLIA STREET
|
BEATSON ROAD (SOUTH END)
|
Left
|
11
|
|
SCOTIA STREET
|
775
|
790
|
ANGLIA STREET
|
BEATSON ROAD (SOUTH END)
|
Left
|
15
|
|
SCOTIA STREET
|
260
|
290
|
BEATSON ROAD (NORTH END)
|
ULSTER STREET
|
Right
|
30
|
|
TOSSWILL ROAD
|
285
|
300
|
STATE HIGHWAY 6
|
CHAMBERLAIN STREET
|
Right
|
15
|
|
ALFRED STREET
|
220
|
230
|
VANGUARD STREET
|
TIPAHI STREET
|
Right
|
10
|
|
BEACH ROAD
|
365
|
385
|
BISLEY WALK
|
WAIKARE STREET
|
Left
|
20
|
|
COLLINGWOOD STREET
|
1535
|
1600
|
BRONTE STREET
|
BROUGHAM STREET
|
Left
|
65
|
|
MILTON STREET
|
380
|
464
|
GROVE ST
|
HALIFAX STREET EAST
|
Left
|
84
|
|
TIPAHI STREET
|
616
|
740
|
MOTUEKA ST
|
TUKUKA ST
|
Left
|
124
|
|
TUCKETT PLACE
|
6
|
95
|
WAIMEA RD
|
END
|
Left
|
89
|
|
TUKUKA STREET
|
0
|
20
|
START
|
TIPAHI ST
|
Right
|
20
|
|
TUKUKA STREET
|
0
|
50
|
START
|
TIPAHI ST
|
Left
|
50
|
|
WAIMEA ROAD
|
34
|
200
|
RUTHERFORD STREET
|
VAN DIEMAN STREET
|
Left
|
166
|
|
WAIMEA ROAD
|
345
|
395
|
RUTHERFORD STREET
|
VAN DIEMAN STREET
|
Left
|
50
|
|
WAIMEA ROAD
|
1950
|
1975
|
TUKUKA STREET
|
BOUNDARY ROAD
|
Left
|
25
|
|
WAIMEA ROAD
|
96
|
111
|
RUTHERFORD STREET
|
VAN DIEMAN STREET
|
Right
|
15
|
|
WAIMEA ROAD
|
1606
|
1625
|
TUKUKA STREET
|
BOUNDARY ROAD
|
Left
|
19
|
|
AKERSTEN STREET
|
218
|
228
|
WILDMAN AVENUE
|
MARINA CAR PARK
|
Left
|
10
|
|
ALFRED STREET
|
126
|
136
|
VANGUARD STREET
|
TIPAHI STREET
|
Right
|
10
|
|
ALFRED STREET
|
200
|
210
|
VANGUARD STREET
|
TIPAHI STREET
|
Right
|
10
|
|
ALFRED STREET
|
290
|
317
|
TIPAHI STREET
|
KAWAI STREET (NORTH)
|
Right
|
27
|
|
BISLEY AVENUE
|
580
|
630
|
CHAMPION TCE
|
MOANA AVE
|
Left
|
50
|
|
BOLT ROAD
|
310
|
345
|
PARKERS ROAD ROUNDABOUT (BOLT)
|
ROTHERHAM STREET
|
Left
|
35
|
|
BOUNDARY ROAD
|
6
|
116
|
WAIMEA RD
|
KAWAI ST SOUTH
|
Left
|
110
|
|
BROOK STREET
|
308
|
490
|
STORE
|
BLICK TERRACE
|
Left
|
182
|
|
JENNER ROAD
|
320
|
335
|
JENNER ROAD CUL-DE-SAC 1
|
JENNER ROAD CUL-DE-SAC 2
|
Left
|
15
|
|
JENNER ROAD
|
400
|
425
|
JENNER ROAD CUL-DE-SAC 1
|
JENNER ROAD CUL-DE-SAC 2
|
Left
|
25
|
|
JERNINGHAM STREET
|
0
|
112
|
TORLESSE ST
|
END
|
Left
|
112
|
|
KARAKA STREET
|
10
|
62
|
TITOKI ST
|
POLSTEAD RD
|
Right
|
52
|
|
KARAKA STREET
|
175
|
250
|
TITOKI ST
|
POLSTEAD RD
|
Right
|
75
|
|
KARAKA STREET
|
72
|
167
|
TITOKI ST
|
POLSTEAD RD
|
Right
|
95
|
|
KAWAI STREET (NORTH)
|
401
|
445
|
ALFRED ST
|
FRANKLYN ST
|
Left
|
44
|
|
KAWAI STREET (SOUTH)
|
667
|
690
|
TIPAHI ST
|
BOUNDRY RD
|
Left
|
23
|
|
KAWAI STREET (SOUTH)
|
160
|
200
|
MOTUEKA ST
|
TUKUKA ST
|
Left
|
40
|
|
KAWAI STREET (SOUTH)
|
615
|
664
|
TIPAHI ST
|
BOUNDRY RD
|
Left
|
49
|
|
MARSDEN ROAD
|
360
|
396
|
MAIN RD STOKE
|
THE RIDGEWAY
|
Left
|
36
|
|
MOANA AVENUE
|
185
|
205
|
BISLEY AVENUE
|
CENTRE MOANA AVENUE ROUNDABOUT (STA
|
Right
|
20
|
|
MOANA AVENUE
|
679
|
830
|
MONCRIEFF AVENUE (PAINTED CENTRELIN
|
PRINCES DRIVE ROUNDABOUT (MOANA)
|
Left
|
151
|
|
MURPHY STREET
|
190
|
202
|
EMANO ST
|
JENNER ROAD
|
Right
|
12
|
|
NILE STREET (EAST)
|
740
|
816
|
TASMAN ST
|
DOMETT ST
|
Left
|
76
|
|
NILE STREET (EAST)
|
1210
|
1258
|
DOMETT ST
|
MAITAI RD
|
Left
|
48
|
|
PRINCES DRIVE
|
970
|
990
|
MOANA ROAD
|
ROAD NARROWS
|
Left
|
20
|
|
SCOTIA STREET
|
170
|
182
|
BEATSON ROAD (NORTH END)
|
ULSTER STREET
|
Right
|
12
|
|
SCOTIA STREET
|
729
|
749
|
ROAD NARROWS
|
ANGLIA STREET
|
Right
|
20
|
|
SCOTIA STREET
|
754
|
775
|
ANGLIA STREET
|
BEATSON ROAD (SOUTH END)
|
Left
|
21
|
|
SCOTIA STREET
|
790
|
815
|
ANGLIA STREET
|
BEATSON ROAD (SOUTH END)
|
Left
|
25
|
|
SCOTIA STREET
|
825
|
850
|
ANGLIA STREET
|
BEATSON ROAD (SOUTH END)
|
Left
|
25
|
|
SCOTIA STREET
|
851
|
884
|
ANGLIA STREET
|
BEATSON ROAD (SOUTH END)
|
Left
|
33
|
|
SCOTIA STREET
|
895
|
947
|
ANGLIA STREET
|
BEATSON ROAD (SOUTH END)
|
Left
|
52
|
|
SCOTIA STREET
|
749
|
948
|
ANGLIA STREET
|
BEATSON ROAD (SOUTH END)
|
Right
|
199
|
|
STANSELL AVENUE
|
240
|
270
|
PADDYS KNOB ACCESS
|
CHANGE IN CARRIAGEWAY WIDTH
|
Right
|
30
|
|
STANSELL AVENUE
|
360
|
390
|
CHANGE IN CARRIAGEWAY WIDTH
|
TOSSWILL ROAD
|
Right
|
30
|
|
THE RIDGEWAY (NORTH)
|
981
|
1017
|
ARAPIKI ROAD
|
MARSDEN ROAD
|
Left
|
36
|
|
TIPAHI STREET
|
937
|
947
|
TUKUKA ST
|
KAWAI ST
|
Left
|
10
|
|
TORLESSE STREET
|
4
|
165
|
WATERHOUSE ST
|
START ONE WAY
|
Left
|
161
|
|
WAIMEA ROAD
|
3993
|
4083
|
BEATSONS ROAD (SOUTH END)
|
WATERHOUSE STREET
|
Left
|
90
|
|
WAIMEA ROAD
|
3898
|
3991
|
BEATSONS ROAD (SOUTH END)
|
WATERHOUSE STREET
|
Left
|
93
|
|
WASHINGTON ROAD
|
470
|
600
|
HASTINGS ST
|
PRINCES DR
|
Left
|
130
|
|
WATERHOUSE STREET
|
6
|
50
|
WAIMEA RD
|
COSTER
|
Right
|
44
|
|
WATERHOUSE STREET
|
6
|
111
|
WAIMEA RD
|
COSTER
|
Left
|
105
|
|
WESTBROOK TERRACE
|
265
|
325
|
MIRO ST
|
HINAU ST
|
Right
|
60
|
|
|
|
|
|
|
|
|
* Priority
shown indicates the current condition of the footpath, however UFB schedule
may be different.
|
|
|